What’s new in Grafana v9.0
As tradition goes, GrafanaCon — our yearly community event for Grafana open source users — is also where we launch the latest software release of Grafana. Keeping up with tradition, we are excited to be announcing Grafana v9.0: a release that elevates Grafana’s ease of use, discovery of data through new and improved visualizations and a default Grafana Alerting experience.
A big focus for Grafana is making observability and data visualization and analytics easier and more accessible for everyone. For popular data sources like Prometheus and Loki, writing and understanding queries can be hard. This is why we are excited to announce that Grafana 9 comes with new visual query builders for both these data sources. These visual query builders will lower the barrier of entry and they help anyone to compose, understand and learn how the underlying query languages.
The release also includes a brand-new powerful and fast heatmap visualization, a more accessible navigation menu, improvements to dashboard search, advanced security and authentication features, and more.
We’ve summarized what’s new in the release here. If you’d like all the details you can check out the complete changelog.
Prometheus query builder
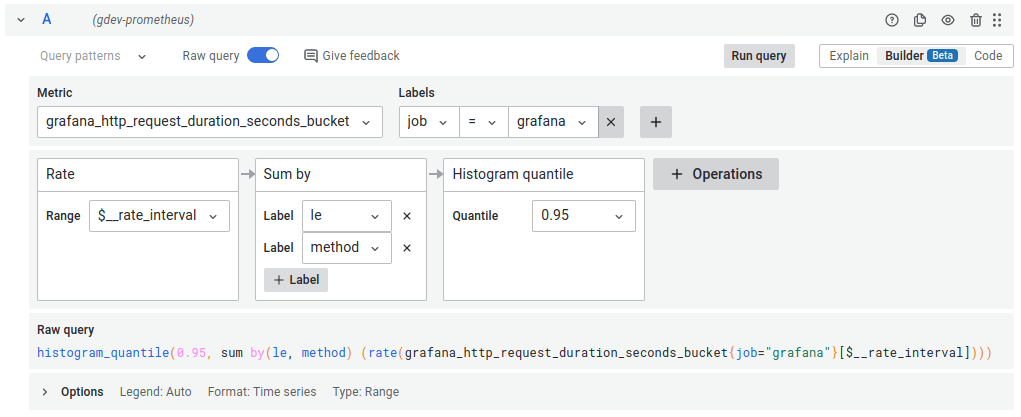
Prometheus queries are not the easiest to write or understand. The PromQL query language is very complex and advanced. Even relatively simple queries are hard to compose and read for new users. This is why we are introducing a new UI query builder that allows anyone to compose and learn how Prometheus queries work.
Metric and label filters
This new query builder allows you to easily search and select a metric as well as building label filters. You can start either the selecting a metric or a label filter as they both act as filters on each other. The metric selector allow you to search on multiple parts of the metric name at the same time, just separate each search string with a whitespace.
Operations
All functions, aggregations and binary operations are added via the + Operation button. Operations are presented in the order they are executed, not in the inverted order they are written in the text query. This makes queries a lot easier to read and reason about as you now clearly see what function parameter is going to which function as well as information about parameter names and function documentation integrated into the builder.
Range vector
The query builder will automatically manage and add the range selector. It will be shown as a parameter to the operations that require a range vector (rate, delta, increase, etc).
Loki query builder
Loki also has complex and powerful query language in LogQL. In many ways it’s more complex and has more syntax to remember than PromQL. Luckily the new query builder we are introducing in Grafana v 9.0 will help you write and understand Loki queries without knowing any of the syntax. Take a look at this example log query.
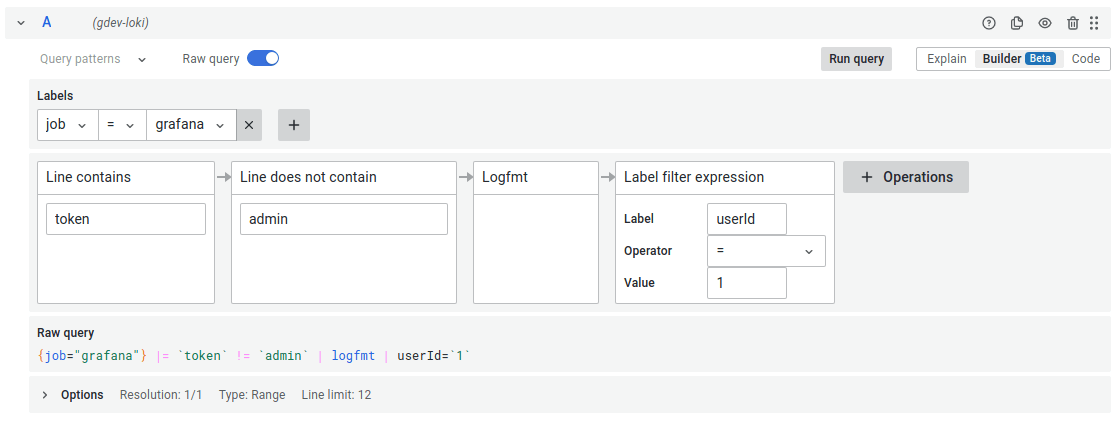
In the query builder you can add and edit label filters, line filters, parsers and functions. The image above shows a log query but you can also do metric queries.
The Loki query builder supports all the features listed for the prometheus query builder above, including support for nested binary operations, explain mode and switching between text editor and builder while preserving changes.
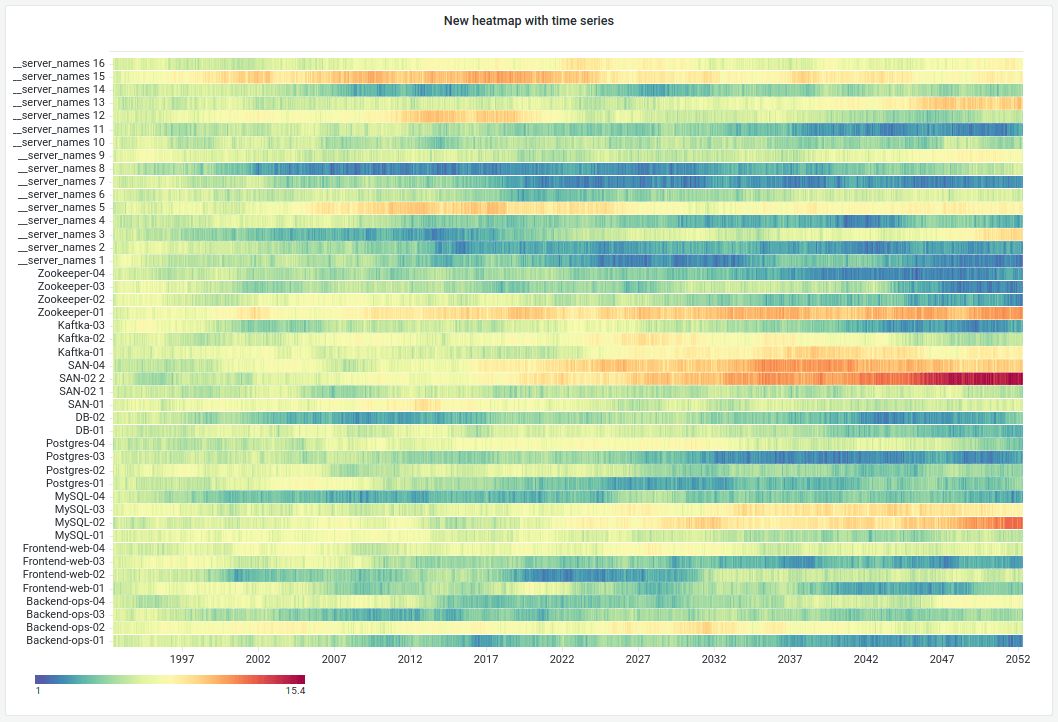
New heatmap panel
We are replacing the old heatmap panel with a new modern panel that is using the new panel option architecture.
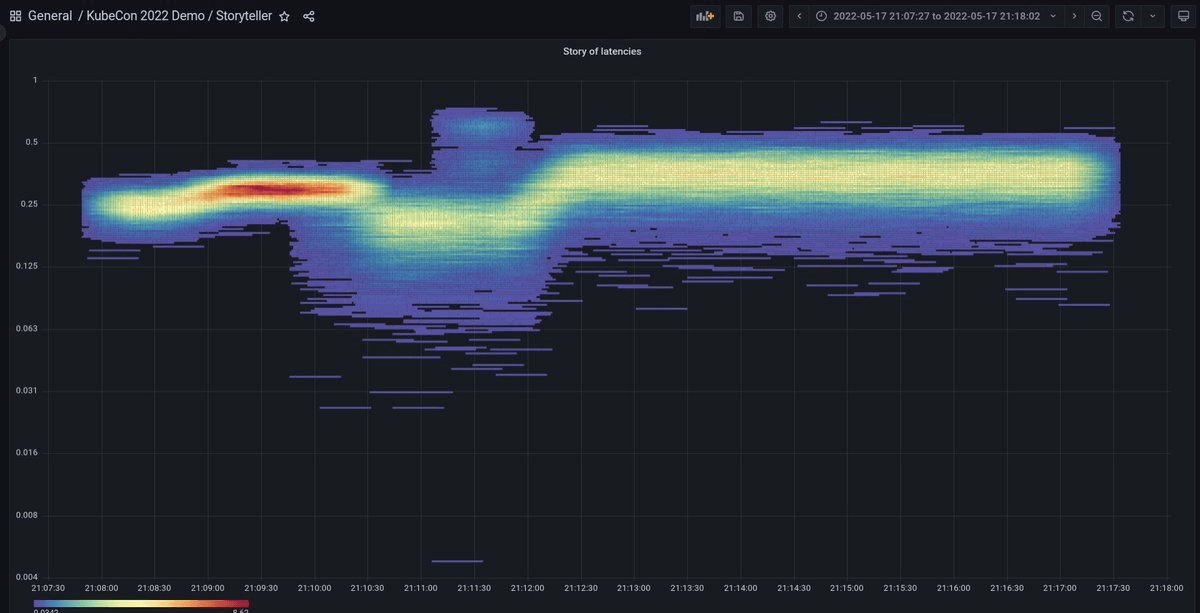
New new heatmap panel has a number enhancements compared to the old version.
-
Multiple orders of magnitude faster
-
Supports showing exemplars (traces) overlay
-
Supports Prometheus sparse histograms
-
Supports changing number of colors steps
-
For unbucketed data, it performs smarter auto bucket sizing
-
Supports filtering out bucket values close to but not exactly zero
The new heatmap by default assumes that the data is pre-bucketed. So if your query returns time series each series is seen as separate bucket (y axis tick). The panel is so much faster than the old one so it can render many time series with thousands of data points each without issue.
Grafana Alerting is the default in Grafana 9
Grafana Alerting is now on by default if you upgrade from an earlier version of Grafana. If you have been using legacy alerting in an earlier version of Grafana and you upgrade to Grafana 9 your alert rules will be automatically migrated and the legacy alerting interface will be replaced by the Grafana Alerting interface.
Grafana Alerting, called unified alerting in Grafana 8, has been available since June, 2021 now provides feature parity with legacy alerting and many additional benefits. To find out more on the process to revert back to legacy alerts if needed, click here. Note that if you do revert back (by setting the Grafana config flag GF_UNIFIED_ALERTING_ENABLED to false), that we expect to remove legacy alerting in the next major Grafana release, Grafana 10.
Alert state history for Grafana managed alerts
Alert state history for Grafana managed alerts indicates the cause of the state. Alert rules can be configured to use the “Alerting” or “OK” states when rule evaluations result in Error or NoData conditions. This change tracks the difference between, for example, Alerting, Alerting (NoData), and Alerting (Error). This change also updates the UI to handle the new serialized states: filtering, sorting, and coloring.
Images in notifications for Grafana managed alerts
Grafana Alerting now provides the ability to capture an image for Grafana managed alerts and deliver it via a notification. This is configurable via the contact points tab of Grafana Alerting . This functionality was available in legacy dashboard alerting, but was missing in Grafana Alerting. It requires the alert to be related to a specific dashboard panel using the “Dashboard UID” and “Panel ID” annotations.
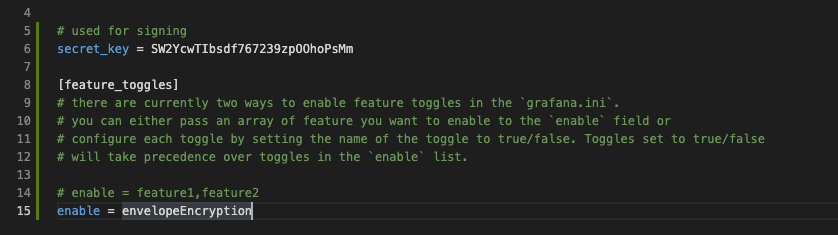
Envelope encryption is generally available and enabled by default
Grafana now uses envelope encryption to encrypt secrets in the database. Envelope encryption adds a layer of indirection to the encryption process. Instead of encrypting all secrets in the database with a single key, Grafana uses a set of keys called data encryption keys (DEKs) to encrypt them. These data encryption keys are themselves encrypted with a single key encryption key (KEK). This allows you to rotate your KEK and quickly re-encrypt your DEKs in case a key is compromised. In Grafana Enterprise, you can also store your KEK in an external key management service (KMS) like AWS KMS or Azure Key Vault, for extra security. Learn more about envelope encryption in the database encryption documentation.
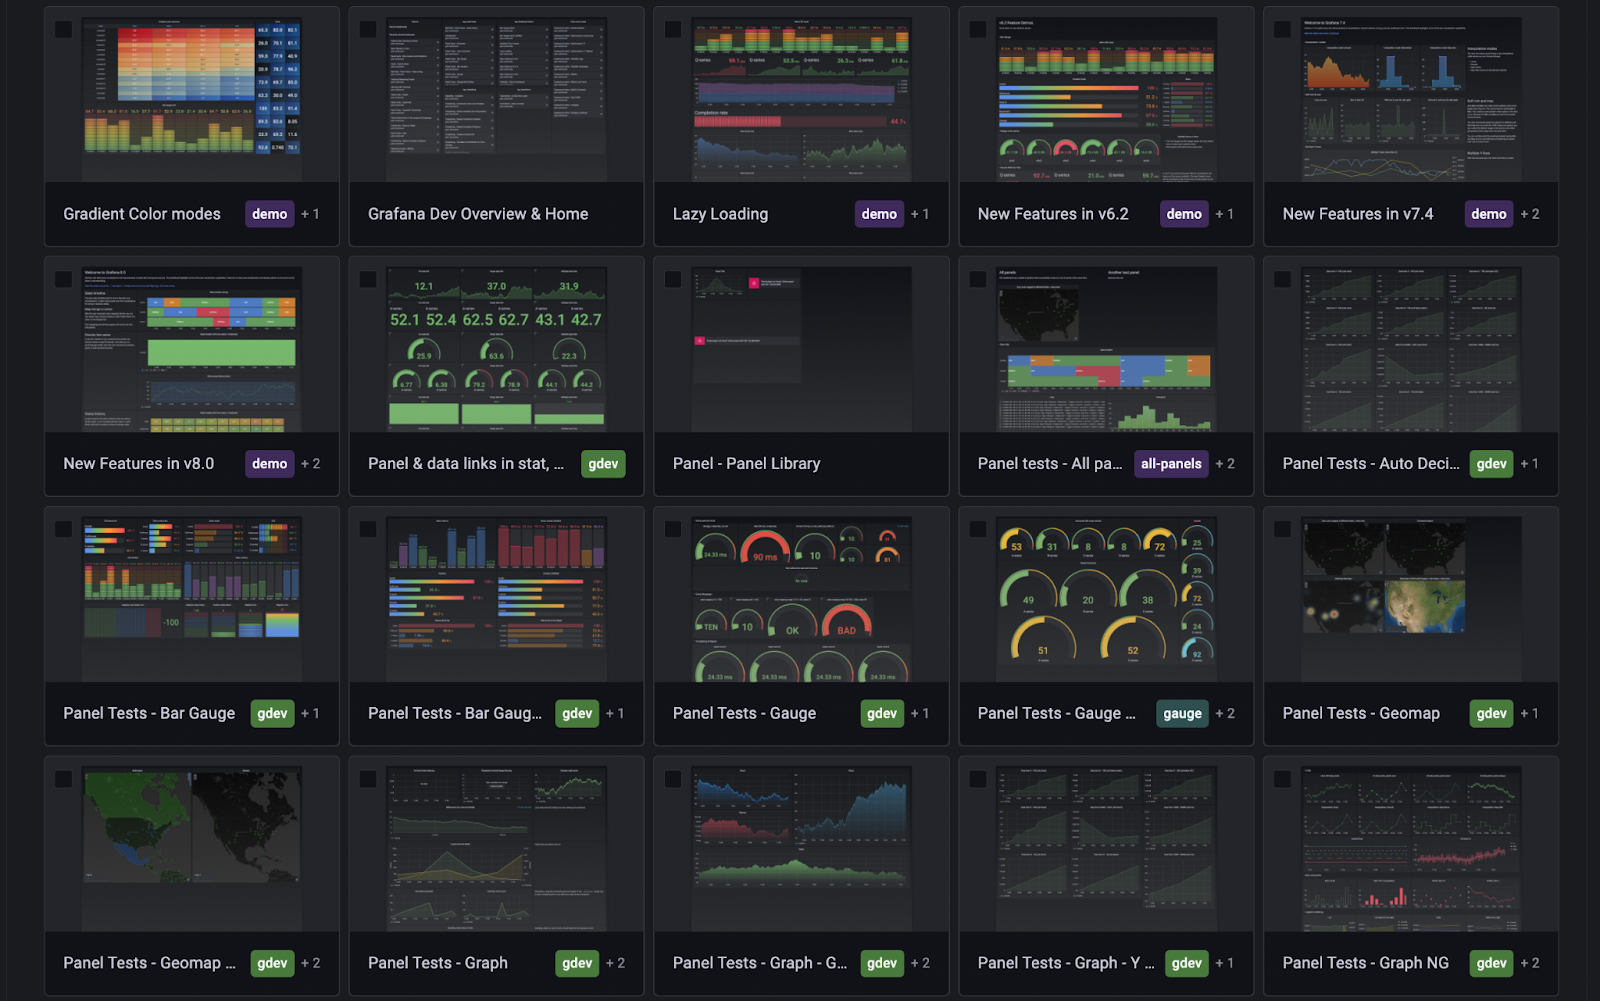
Dashboard previews (opt-in beta)
The dashboard previews initially came to life during our internal Grafana Labs Hackathon, and are now ready for an opt-in beta release. The previews provide an overview of all available dashboards and help you quickly find the right dashboard when the dashboard names aren’t enough.
Panel title search (opt-in beta)
Grafana 9 has a feature toggle panelTitleSearch. When enabled, it tells Grafana to use a new search engine. Instead of using SQL queries, the new search uses an in-memory full-text index. That provides a better search experience and additionally allows searching through panel titles.
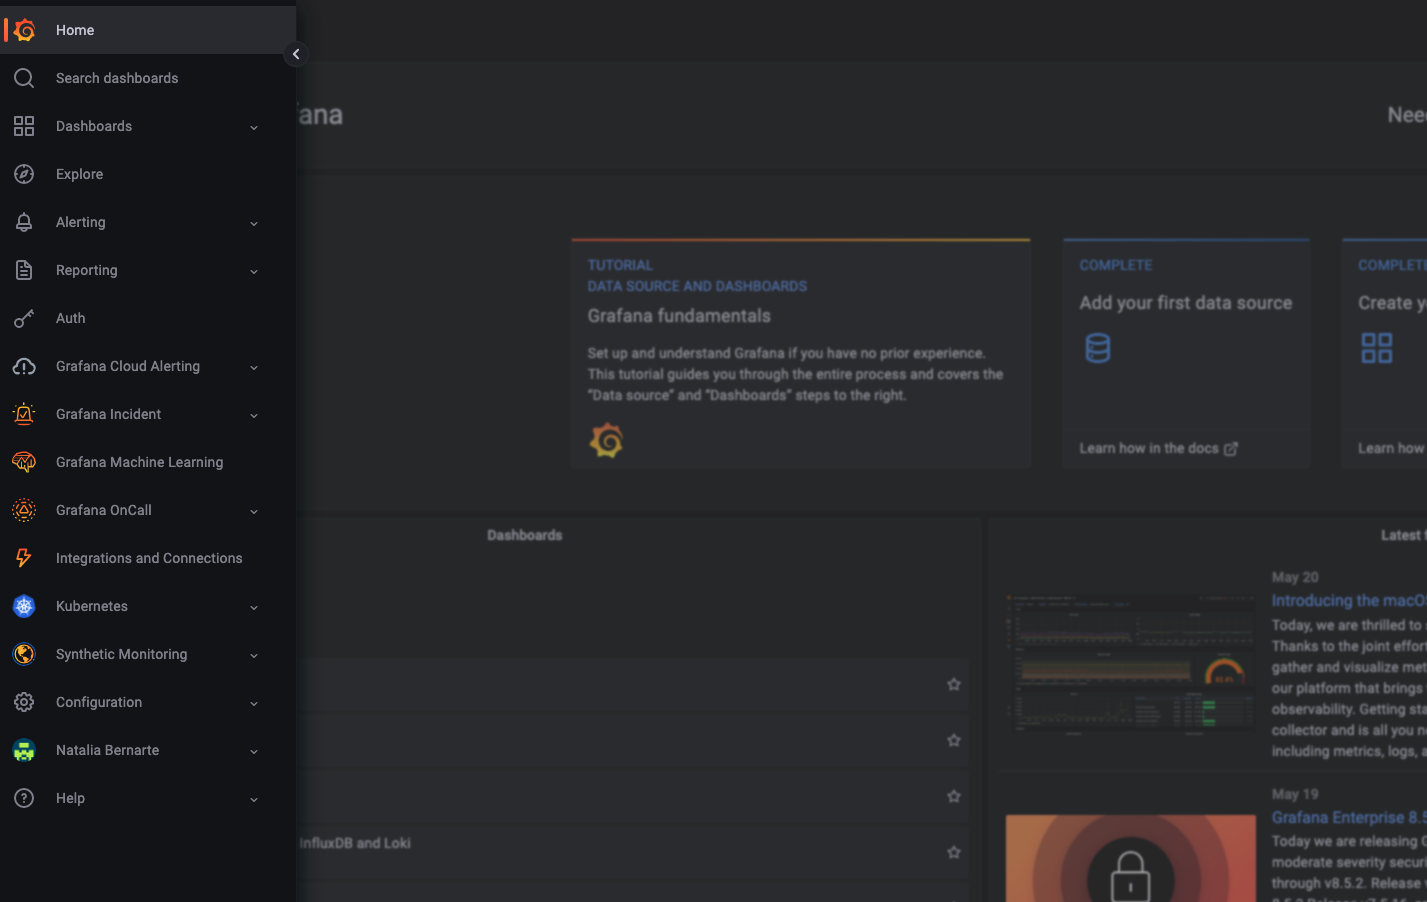
Expanding the navigation bar
You can expand the navigation bar for a better overview of Grafana’s features and installed integrations. This is the first improvement to Grafana’s navigation, with more to come in future releases.
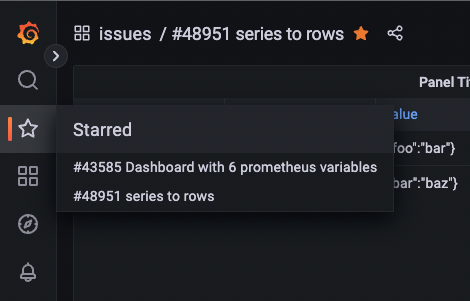
Starred dashboards in the navigation bar
As part of the upcoming improvements to Grafana’s navigation, you can now directly access your starred dashboards from the navigation bar. This is currently an opt-in feature that can be accessed by enabling the savedItems feature flag.
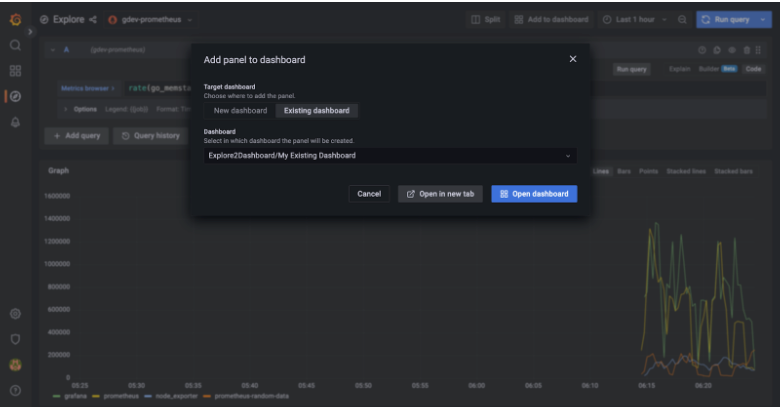
Explore to Dashboard
It is now possible to create panels and/or dashboards directly from Explore. When clicking on the “Add to dashboard” button in the Explore toolbar users can now create a panel in a new dashboard or in an existing one. The generated panel contains all the pane’s queries and a default visualization automatically picked from the current results shown in Explore. Dashboards are not automatically saved so that users can go through the current save flow. Optionally, dashboards can be opened in a new tab to preserve Explore’s state.