Query tracing data
The Tempo data source’s query editor helps you query and display traces from Tempo in Explore.
This topic explains configuration and queries specific to the Tempo data source. For general documentation on querying data sources in Grafana, see Query and transform data.
To add TraceQL panels to your dashboard, refer to the Traces panel documentation.
To learn more about Grafana dashboards, refer to the Use dashboards documentation.
Write TraceQL queries in Grafana
You can compose TraceQL queries in Grafana and Grafana Cloud using Explore and a Tempo data source. You can use either the Query type > Search (the TraceQL query builder) or the TraceQL tab (the TraceQL query editor). Both of these methods let you build queries and drill-down into result sets.
To learn more about how to query by TraceQL, refer to the TraceQL documentation.
TraceQL query builder
The TraceQL query builder, located on the Explore > Query type > Search in Grafana, provides drop-downs and text fields to help you write a query.
Refer to the Search using the TraceQL query builder documentation to learn more about creating queries using convenient drop-down menus.
image::screenshot-traceql-query-type-search-v10.png
TraceQL query editor
The TraceQL query editor, located on the Explore > TraceQL tab in Grafana, lets you search by trace ID and write TraceQL queries using autocomplete.
Refer to the TraceQL query editor documentation to learn more about constructing queries using a code-editor-like experience.
image::screenshot-traceql-query-editor-v10.png
Query by search (deprecated)
CAUTION: Starting with Grafana v10.2, this query type has been deprecated. It will be removed in Grafana v10.3.
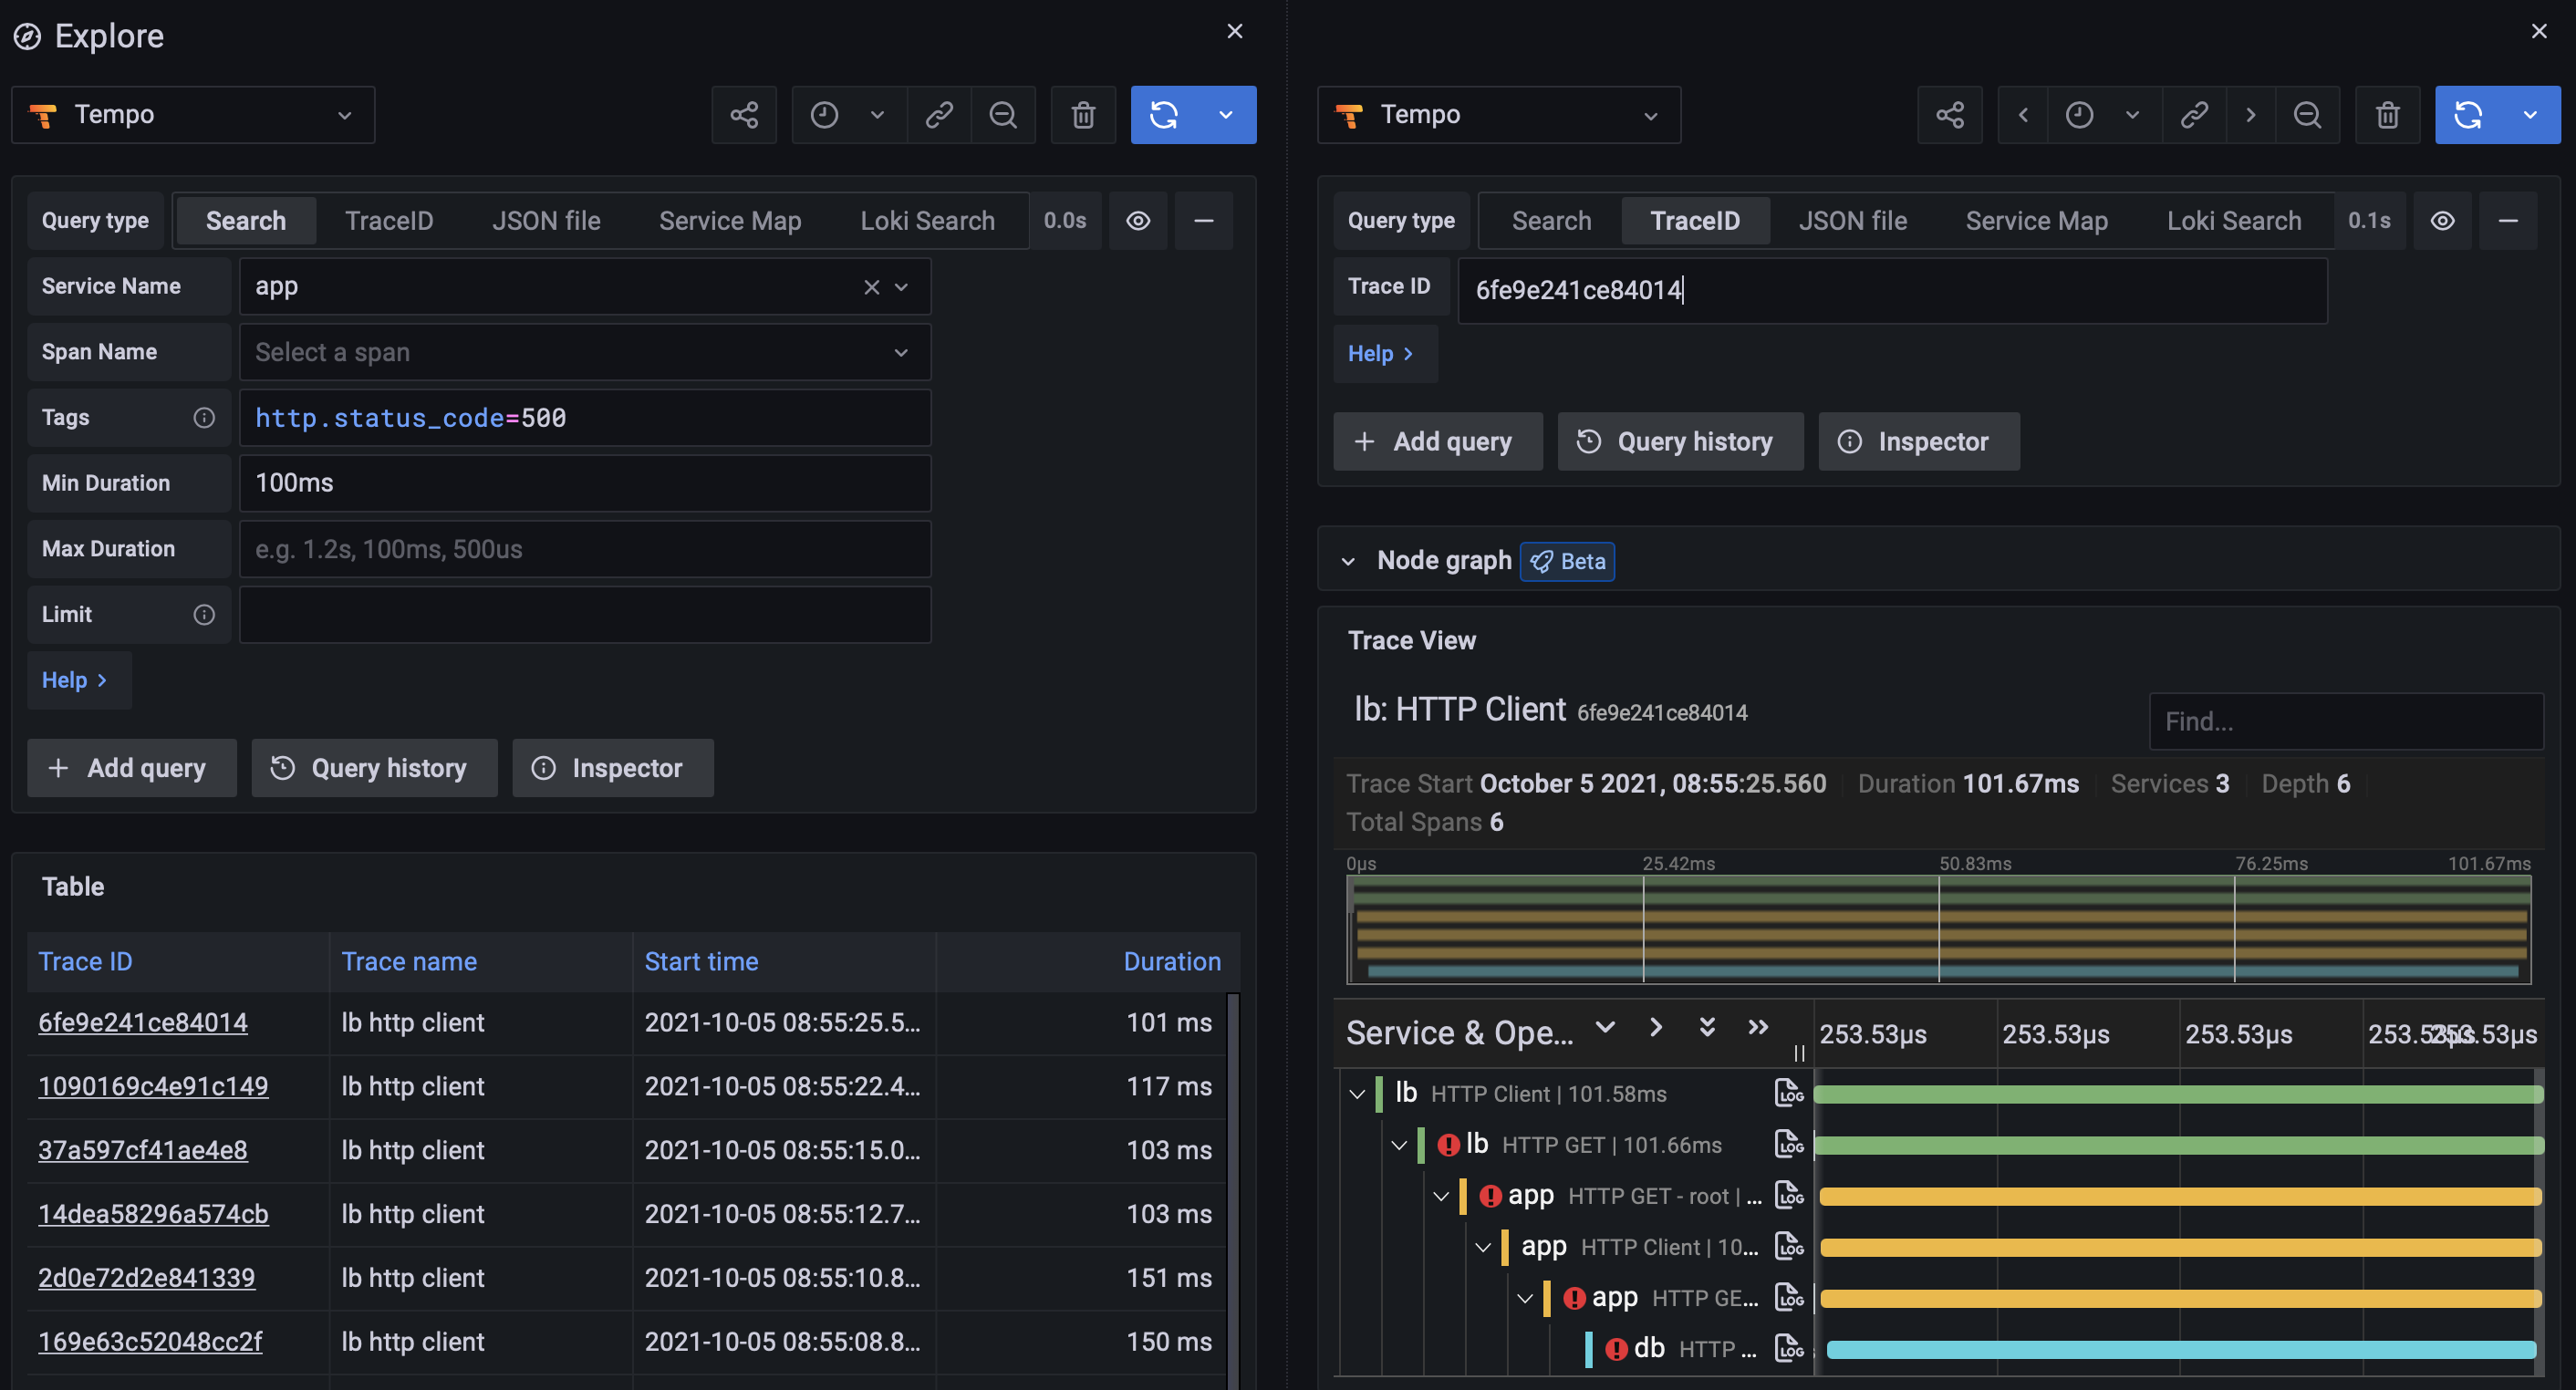
Use this to search for traces by service name, span name, duration range, or process-level attributes that are included in your application’s instrumentation, such as HTTP status code and customer ID.
To configure Tempo and the Tempo data source for search, refer to Configure the data source.
To search for traces:
-
Select Search from the Query type selector.
-
Fill out the search form:
| Name | Description |
|---|---|
Service Name |
Returns a list of services. |
Span Name |
Returns a list of span names. |
Tags |
Sets tags with values in the logfmt format, such as |
Min Duration |
Filters all traces with a duration higher than the set value. Possible values are |
Max Duration |
Filters all traces with a duration lower than the set value. Possible values are |
Limit |
Limits the number of traces returned. |

Search recent traces
You can search recent traces held in Tempo’s ingesters. By default, ingesters store the last 15 minutes of tracing data.
To configure your Tempo data source to use this feature, refer to the Tempo documentation.
Search the backend datastore
Tempo includes the ability to search the entire backend datastore.
To configure your Tempo data source to use this feature, refer to the Tempo documentation.
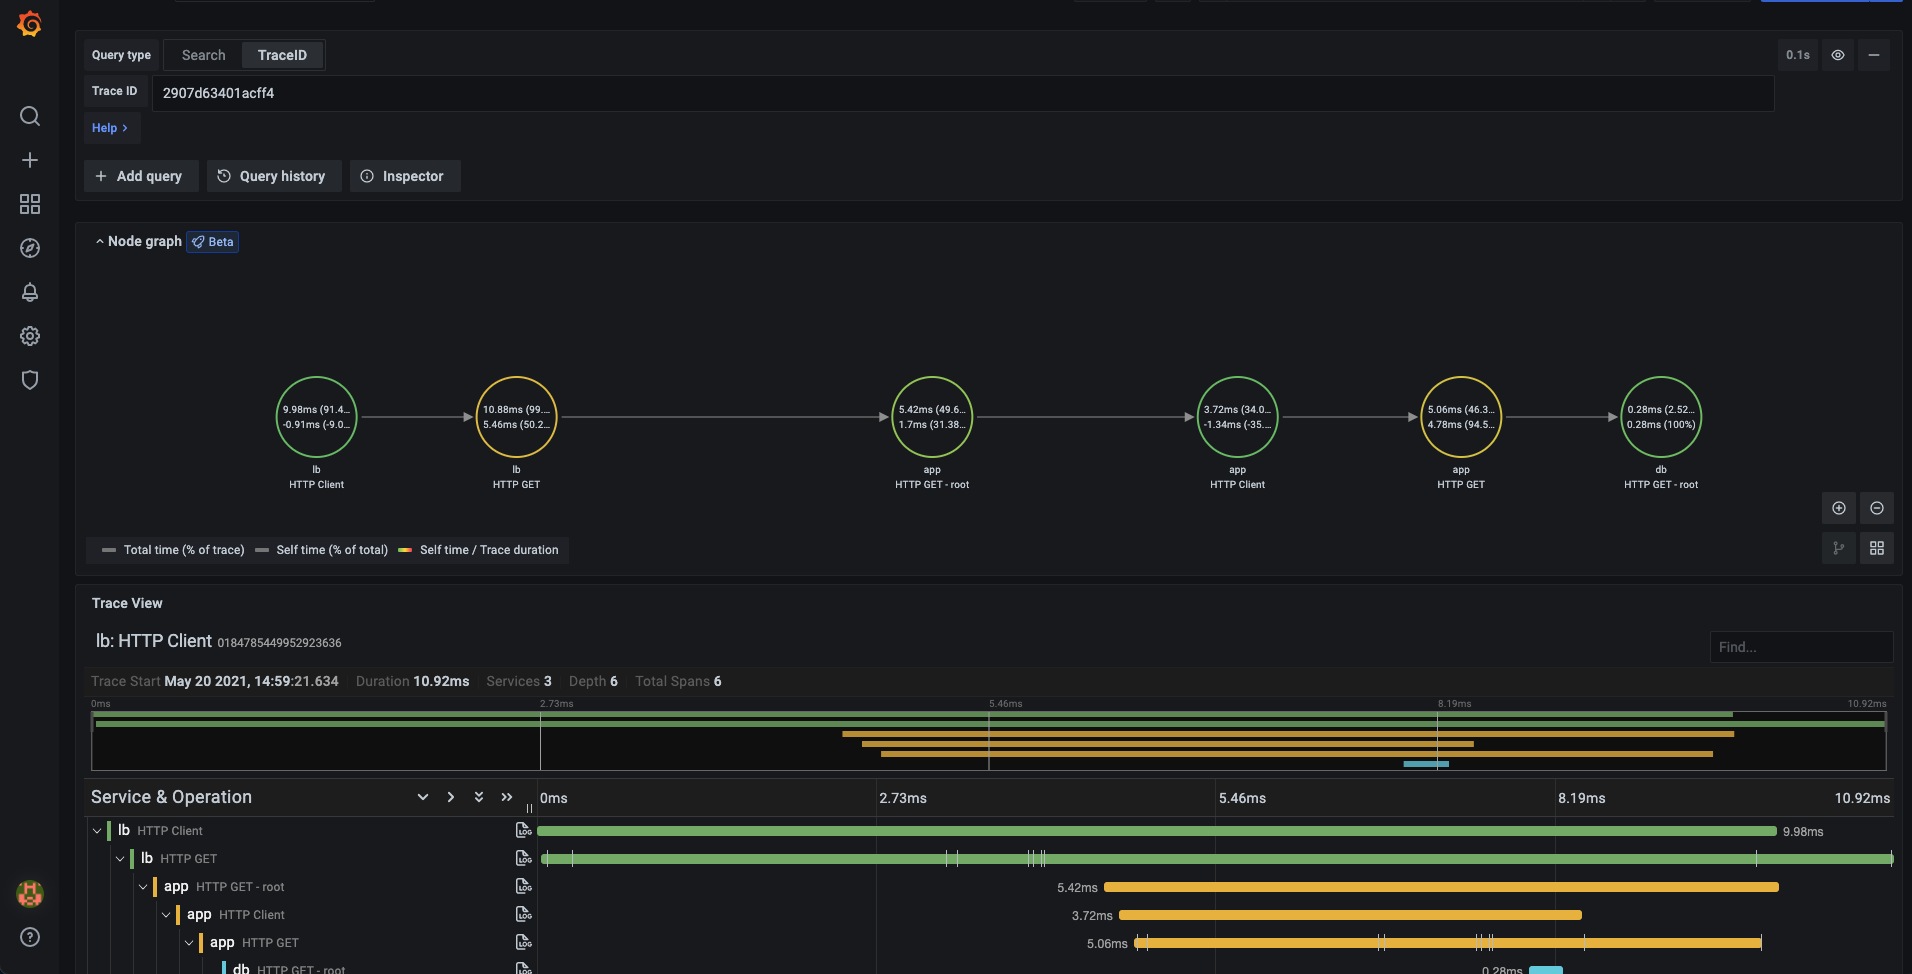
Query by TraceID
To query a particular trace:
-
Select the TraceQL query type.
-
Enter the trace’s ID into the query field.

Query Loki for traces
CAUTION: Starting with Grafana v11.0, the Loki query tab will no longer be available.
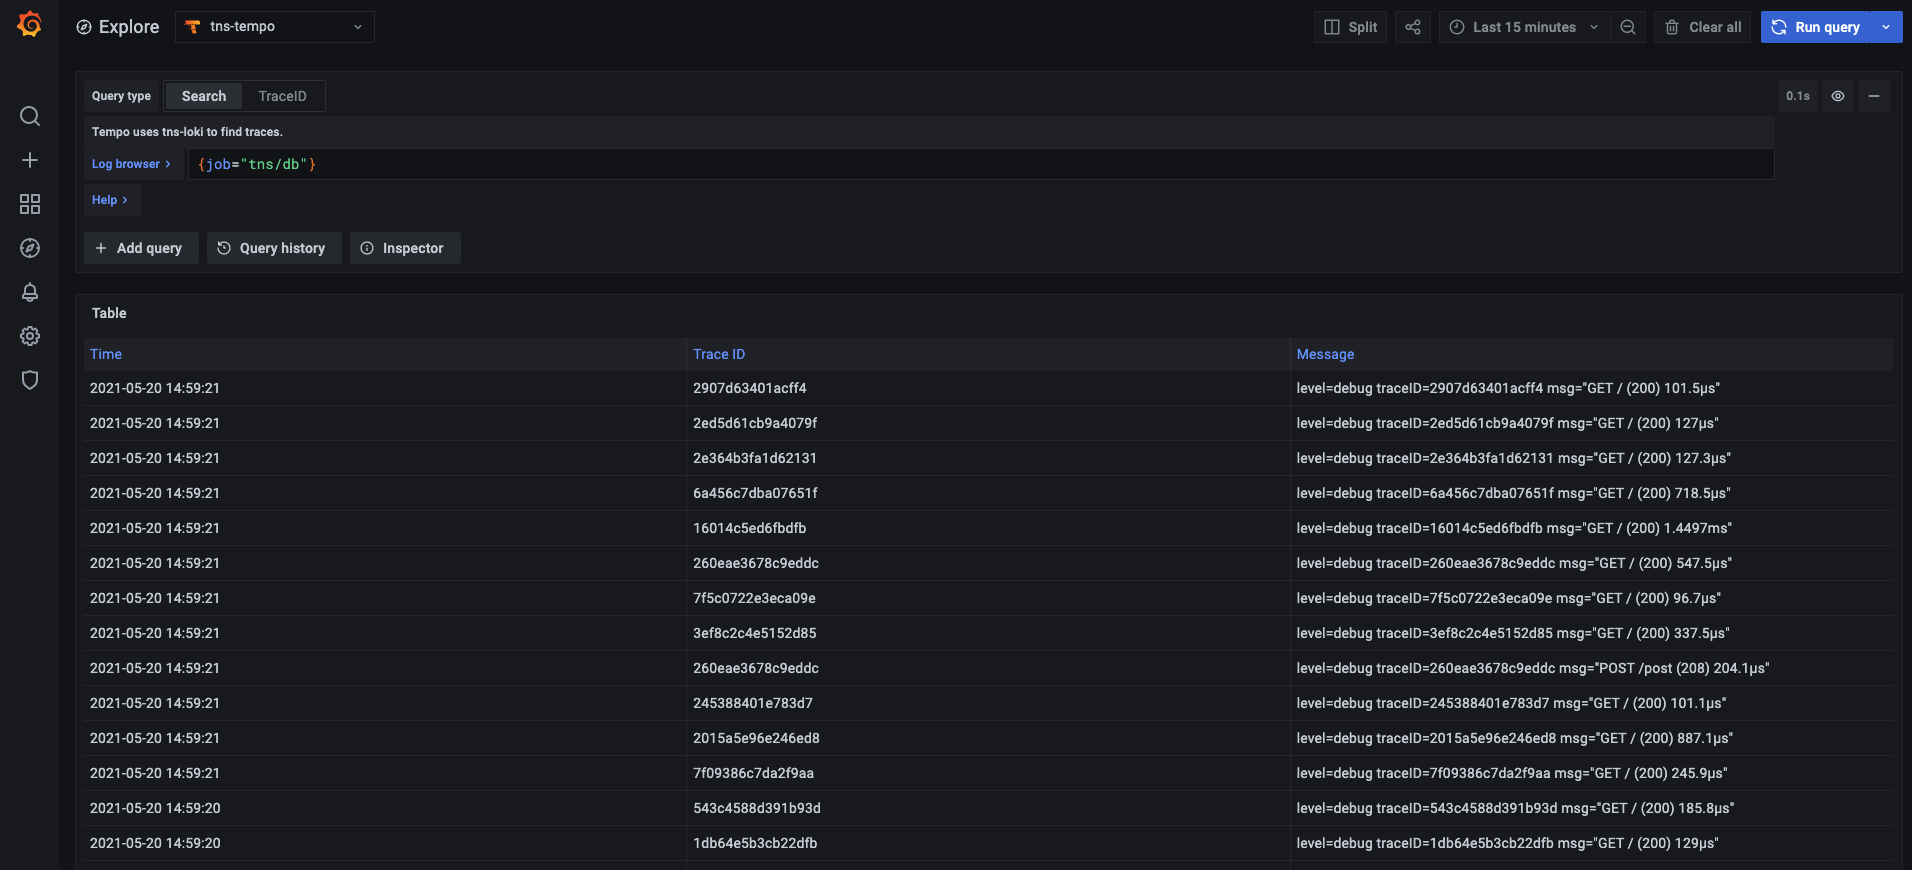
To find traces to visualize, you can use the Loki query editor. For results, you must configure derived fields in the Loki data source that point to this data source.
