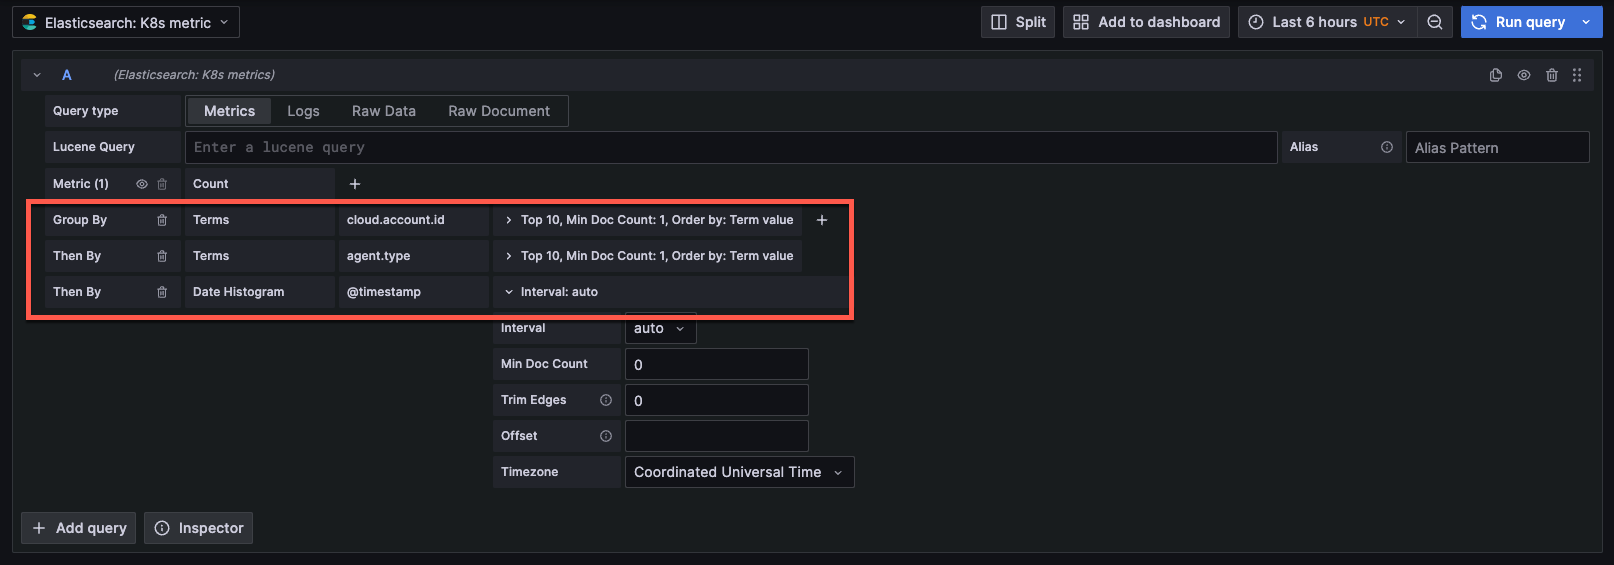
Elasticsearch query editor
Grafana provides a query editor for Elasticsearch. Elasticsearch queries are in Lucene format. See Lucene query syntax and and Query string syntax if you are new to working with Lucene queries in Elasticsearch.

For general documentation on querying data sources in Grafana, including options and functions common to all query editors, see Query and transform data.
Aggregation types
Elasticsearch groups aggregations into three categories:
-
Bucket - Bucket aggregations don’t calculate metrics, they create buckets of documents based on field values, ranges and a variety of other criteria. See Bucket aggregations for additional information. Use bucket aggregations under
Group bywhen creating a metrics query in the query builder. -
Metrics - Metrics aggregations perform calculations such as sum, average, min, etc. They can be single-value or multi-value. See Metrics aggregations for additional information. Use metrics aggregations in the metrics query type in the query builder.
-
Pipeline - Elasticsearch pipeline aggregations work with inputs or metrics created from other aggregations (not documents or fields). There are parent and sibling and sibling pipeline aggregations. See Pipeline aggregations for additional information.
Select a query type
There are three types of queries you can create with the Elasticsearch query builder. Each type is explained in detail below.
Metrics query type
Metrics queries aggregate data and produce a variety of calculations such as count, min, max, etc. Click on the metric box to view a list of options in the dropdown menu. The default is count.
-
Alias - Aliasing only applies to time series queries, where the last group is
date histogram. This is ignored for any other type of query. -
Metric - Metrics aggregations include:
-
count - see Value count aggregation
-
average - see Avg aggregation
-
sum - see Sum aggregation
-
max - see Max aggregation
-
min - see Min aggregation
-
extended stats - see Extended stats aggregation
-
percentiles - see Percentiles aggregation
-
unique count - see Cardinality aggregation
-
top metrics - see Top metrics aggregation
-
rate - see Rate aggregation
-
You can select multiple metrics and group by multiple terms or filters when using the Elasticsearch query editor.
Use the + sign to the right to add multiple metrics to your query. Click on the eye icon next to Metric to hide metrics, and the garbage can icon to remove metrics.
-
Group by options - Create multiple group by options when constructing your Elasticsearch query. Date histogram is the default option. Below is a list of options in the dropdown menu.
-
terms - see Terms aggregation.
-
filter - see Filter aggregation.
-
geo hash grid - see Geohash grid aggregation.
-
date histogram - for time series queries. See Date histogram aggregation.
-
histogram - Depicts frequency distributions. See Histogram aggregation.
-
nested (experimental) - See Nested aggregation.
-
Each group by option will have a different subset of options to further narrow your query.
The following options are specific to the date histogram bucket aggregation option.
-
Time field - Depicts date data options. The default option can be specified when configuring the Elasticsearch data source in the Time field name under the Elasticsearch details section. Otherwise @timestamp field will be used as a default option.
-
Interval - Group by a type of interval. There are option to choose from the dropdown menu to select seconds, minutes, hours or day. You can also add a custom interval such as
30d(30 days).Autois the default option. -
Min doc count - The minimum amount of data to include in your query. The default is
0. -
Thin edges - Select to trim edges on the time series data points. The default is
0. -
Offset - Changes the start value of each bucket by the specified positive() or negative (-) offset duration. Examples include `+1h` for 1 hour,
5sfor 5 seconds or1dfor 1 day. -
Timezone - Select a timezone from the dropdown menu. The default is
Coordinated universal time.
Configure the following options for the terms bucket aggregation option:
-
Order - Sets the order of data. Options are
toporbottom. -
Size - Limits the number of documents, or size of the data set. You can set a custom number or
no limit. -
Min doc count - The minimum amount of data to include in your query. The default is
0. -
Order by - Order terms by
term value,doc countorcount. -
Missing - Defines how documents missing a value should be treated. Missing values are ignored by default, but they can be treated as if they had a value. See Missing value in Elasticsearch’s documentation for more information.
Configure the following options for the filters bucket aggregation option:
-
Query - Specify the query to create a bucket of documents (data). Examples are
hostname:"hostname1",product:"widget5". Use the * wildcard to match any number of characters. -
Label - Add a label or name to the bucket.
Configure the following options for the geo hash grid bucket aggregation option:
-
Precision - Specifies the number of characters of the geo hash.
Configure the following options for the histogram bucket aggregation option:
-
Interval - Group by a type of interval. There are option to choose from the dropdown menu to select seconds, minutes, hours or day. You can also add a custom interval such as
30d(30 days).Autois the default option. -
Min doc count - The minimum amount of data to include in your query. The default is
0
The nested group by option is currently experimental, you can select a field and then settings specific to that field.
Click the + sign to add multiple group by options. The data will grouped in order (first by, then by).

Use template variables
You can also augment queries by using template variables.
Queries of terms have a 500-result limit by default. To set a custom limit, set the size property in your query.