Microsoft SQL Server query editor
You can create queries with the Microsoft SQL Server data source’s query editor when editing a panel that uses a MS SQL data source.
This topic explains querying specific to the MS SQL data source. For general documentation on querying data sources in Grafana, see Query and transform data.
Choose a query editing mode
You can switch the query editor between two modes:
-
Code mode, which provides a feature-rich editor for writing queries
-
Builder mode, which provides a visual query designer
To switch between the editor modes, select the corresponding Builder and Code tabs above the editor.
To run a query, select Run query located at the top right corner of the editor.
The query editor also provides:
Configure common options
You can configure a MS SQL-specific response format in the query editor regardless of its mode.
Choose a response format
Grafana can format the response from MS SQL as either a table or as a time series.
To choose a response format, select either the Table or Time series formats from the Format dropdown.
To use the time series format, you must name one of the MS SQL columns time. You can use time series queries, but not table queries, in alerting conditions.
For details about using these formats, refer to Use table queries and Use time series queries.
Code mode

In Code mode, you can write complex queries using a text editor with autocompletion features and syntax highlighting.
For more information about Transact-SQL (T-SQL), the query language used by Microsoft SQL Server, refer to the Transact-SQL tutorial.
Use toolbar features
Code mode has several features in a toolbar located in the editor’s lower-right corner.
To reformat the query, click the brackets button ({}).
To expand the code editor, click the chevron button pointing downward.
To run the query, click the Run query button or use the keyboard shortcut Ctrl/Cmd + Enter/Return.
Use autocompletion
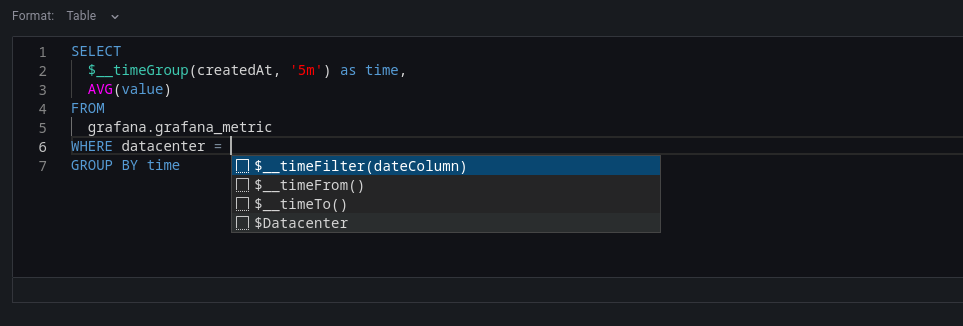
Code mode’s autocompletion feature works automatically while typing. To manually trigger autocompletion, use the keyboard shortcut Ctrl/Cmd + Space.
Code mode supports autocompletion of tables, columns, SQL keywords, standard SQL functions, Grafana template variables, and Grafana macros.
Note: You can’t autocomplete columns until you’ve specified a table.
Builder mode

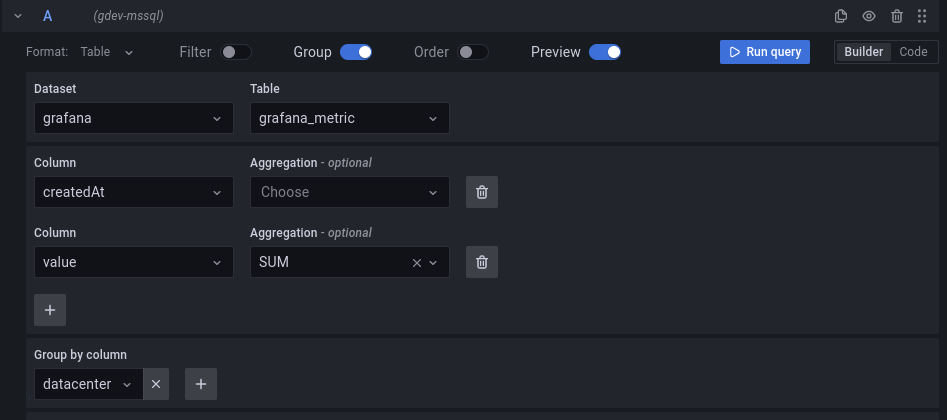
In Builder mode, you can build queries using a visual interface.
Dataset and table selection
In the Dataset dropdown, select the MSSQL database to query. Grafana populates the dropdown with all databases that the user can access. Once you select a database, Grafana populates the dropdown with all available tables.
Note: If a default database has been configured through the Data Source Configuration page (or through a provisioning configuration file), the user will only be able to use that single preconfigured database for querying.
We don’t include tempdb,model,msdb,master databases in the query editor dropdown.
Select columns and aggregation functions (SELECT)
Select a column from the Column dropdown to include it in the data. You can select an optional aggregation function for the column in the Aggregation dropdown.
To add more value columns, click the plus (+) button to the right of the column’s row.
Filter data (WHERE)
To add a filter, toggle the Filter switch at the top of the editor. This reveals a Filter by column value section with two dropdown selectors.
Use the first dropdown to choose whether all of the filters need to match (AND), or if only one of the filters needs to match (OR). Use the second dropdown to choose a filter.
To filter on more columns, click the plus (+) button to the right of the condition dropdown.
To remove a filter, click the x button next to that filter’s dropdown.
After selecting a date type column, you can choose Macros from the operators list and select timeFilter which will add the $__timeFilter macro to the query with the selected date column.
Use macros
To simplify syntax and to allow for dynamic components, such as date range filters, you can add macros to your query.
| Macro example | Replaced by |
|---|---|
|
An expression to rename the column to time. For example, dateColumn as time |
|
An expression to convert a DATETIME column type to Unix timestamp and rename it to time.For example, DATEDIFF(second, ‘1970-01-01’, dateColumn) AS time |
|
A time range filter using the specified column name.For example, dateColumn BETWEEN ‘2017-04-21T05:01:17Z’ AND '`2017-04-21T05:06:17Z’ |
|
The start of the currently active time selection. For example, '`2017-04-21T05:01:17Z’ |
|
The end of the currently active time selection. For example, '`2017-04-21T05:06:17Z’ |
|
An expression usable in GROUP BY clause. Providing a fillValue of NULL or floating value will automatically fill empty series in timerange with that value.For example, CAST(ROUND(DATEDIFF(second, ‘1970-01-01’, time_column)/300.0, 0) as bigint)*300. |
|
Same as above but with a fill parameter so missing points in that series will be added by grafana and 0 will be used as value. |
|
Same as above but NULL will be used as value for missing points. |
|
Same as above but the previous value in that series will be used as fill value if no value has been seen yet NULL will be used (only available in Grafana 5.3+). |
|
Same as |
|
A time range filter using the specified column name with times represented as Unix timestamp. For example, dateColumn > 1494410783 AND dateColumn < 1494497183 |
|
The start of the currently active time selection as Unix timestamp. For example, 1494410783 |
|
The end of the currently active time selection as Unix timestamp. For example, 1494497183 |
|
A time range filter using the specified column name with times represented as nanosecond timestamp. For example, dateColumn > 1494410783152415214 AND dateColumn < 1494497183142514872 |
|
The start of the currently active time selection as nanosecond timestamp. For example, 1494410783152415214 |
|
The end of the currently active time selection as nanosecond timestamp. For example, 1494497183142514872 |
|
Same as |
|
Same as above but also adds a column alias (only available in Grafana 5.3+). |
To suggest more macros, please open an issue in our GitHub repo.
Use table queries
If the Format query option is set to Table for a Table panel, you can enter any type of SQL query. The Table panel then displays the query results with whatever columns and rows are returned.
Example database table:
CREATE TABLE [event] (
  time_sec bigint,
  description nvarchar(100),
  tags nvarchar(100),
)
CREATE TABLE [mssql_types] (
c_bit bit, c_tinyint tinyint, c_smallint smallint, c_int int, c_bigint bigint, c_money money, c_smallmoney smallmoney, c_numeric numeric(10,5),
c_real real, c_decimal decimal(10,2), c_float float,
c_char char(10), c_varchar varchar(10), c_text text,
c_nchar nchar(12), c_nvarchar nvarchar(12), c_ntext ntext,
c_datetime datetime, c_datetime2 datetime2, c_smalldatetime smalldatetime, c_date date, c_time time, c_datetimeoffset datetimeoffset
)
INSERT INTO [mssql_types]
SELECT
1, 5, 20020, 980300, 1420070400, '$20000.15', '£2.15', 12345.12,
1.11, 2.22, 3.33,
'char10', 'varchar10', 'text',
N'☺nchar12☺', N'☺nvarchar12☺', N'☺text☺',
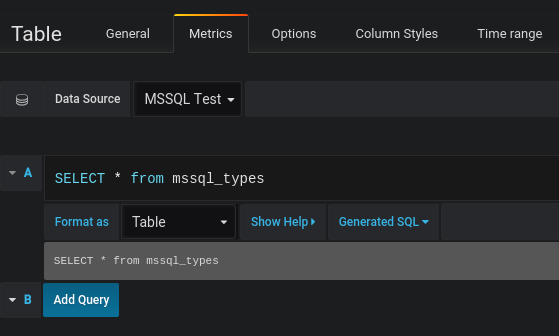
GETDATE(), CAST(GETDATE() AS DATETIME2), CAST(GETDATE() AS SMALLDATETIME), CAST(GETDATE() AS DATE), CAST(GETDATE() AS TIME), SWITCHOFFSET(CAST(GETDATE() AS DATETIMEOFFSET), '-07:00')Query editor with example query:

The query:
SELECT * FROM [mssql_types]To control the name of the Table panel columns, use the standard AS SQL column selection syntax.
For example:
SELECT
  c_bit as [column1], c_tinyint as [column2]
FROM
  [mssql_types]
The resulting table panel:

Use time series queries
If you set the Format setting in the query editor to Time series, then the query must have a column named time that returns either a SQL datetime or any numeric datatype representing Unix epoch in seconds. Result sets of time series queries must also be sorted by time for panels to properly visualize the result.
A time series query result is returned in a wide data frame format. Any column except time or of type string transforms into value fields in the data frame query result. Any string column transforms into field labels in the data frame query result.
Create a metric query
For backward compatibility, there’s an exception to the above rule for queries that return three columns and include a string column named metric. Instead of transforming the metric column into field labels, it becomes the field name, and then the series name is formatted as the value of the metric column. See the example with the metric column below.
To optionally customize the default series name formatting, refer to Standard options definitions.
Example with metric column:
SELECT
  $__timeGroupAlias(time_date_time, '5m'),
  min("value_double"),
  'min' as metric
FROM test_data
WHERE $__timeFilter(time_date_time)
GROUP BY time
ORDER BY 1
Data frame result:
+---------------------+-----------------+
| Name: time          | Name: min       |
| Labels:             | Labels:         |
| Type: []time.Time   | Type: []float64 |
+---------------------+-----------------+
| 2020-01-02 03:05:00 | 3               |
| 2020-01-02 03:10:00 | 6               |
+---------------------+-----------------+
Time series query examples
Using the fill parameter in the $__timeGroupAlias macro to convert null values to be zero instead:
SELECT
  $__timeGroupAlias(createdAt, '5m', 0),
  sum(value) as value,
  hostname
FROM test_data
WHERE
  $__timeFilter(createdAt)
GROUP BY
  time,
  hostname
ORDER BY 1
Given the data frame result in the following example and using the graph panel, you will get two series named value 10.0.1.1 and value 10.0.1.2. To render the series with a name of 10.0.1.1 and 10.0.1.2 , use a Standard options definitions display name value of ${__field.labels.hostname}.
Data frame result:
+---------------------+---------------------------+---------------------------+
| Name: time          | Name: value               | Name: value               |
| Labels:             | Labels: hostname=10.0.1.1 | Labels: hostname=10.0.1.2 |
| Type: []time.Time   | Type: []float64           | Type: []float64           |
+---------------------+---------------------------+---------------------------+
| 2020-01-02 03:05:00 | 3                         | 4                         |
| 2020-01-02 03:10:00 | 6                         | 7                         |
+---------------------+---------------------------+---------------------------+
Using multiple columns:
SELECT
  $__timeGroupAlias(time_date_time, '5m'),
  min(value_double) as min_value,
  max(value_double) as max_value
FROM test_data
WHERE $__timeFilter(time_date_time)
GROUP BY time
ORDER BY 1
Data frame result:
+---------------------+-----------------+-----------------+
| Name: time          | Name: min_value | Name: max_value |
| Labels:             | Labels:         | Labels:         |
| Type: []time.Time   | Type: []float64 | Type: []float64 |
+---------------------+-----------------+-----------------+
| 2020-01-02 03:04:00 | 3               | 4               |
| 2020-01-02 03:05:00 | 6               | 7               |
+---------------------+-----------------+-----------------+
Apply annotations
Annotations overlay rich event information on top of graphs. You can add annotation queries in the Dashboard menu’s Annotations view.
Columns:
| Name | Description |
|---|---|
|
The name of the date/time field. Could be a column with a native SQL date/time data type or epoch value. |
|
Optional name of the end date/time field. Could be a column with a native SQL date/time data type or epoch value. (Grafana v6.6+) |
|
Event description field. |
|
Optional field name to use for event tags as a comma separated string. |
Example database tables:
CREATE TABLE [events] (
  time_sec bigint,
  description nvarchar(100),
  tags nvarchar(100),
)
We also use the database table defined in Time series queries.
Example query using time column with epoch values:
SELECT
  time_sec as time,
  description as [text],
  tags
FROM
  [events]
WHERE
  $__unixEpochFilter(time_sec)
ORDER BY 1
Example region query using time and timeend columns with epoch values:
Only available in Grafana v6.6+.
SELECT
  time_sec as time,
  time_end_sec as timeend,
  description as [text],
  tags
FROM
  [events]
WHERE
  $__unixEpochFilter(time_sec)
ORDER BY 1
Example query using time column of native SQL date/time data type:
SELECT
  time,
  measurement as text,
  convert(varchar, valueOne) + ',' + convert(varchar, valueTwo) as tags
FROM
  metric_values
WHERE
  $__timeFilter(time_column)
ORDER BY 1
Use stored procedures
Stored procedures have been verified to work. However, please note that we haven’t done anything special to support this, so there might be edge cases where it won’t work as you would expect. Stored procedures should be supported in table, time series and annotation queries as long as you use the same naming of columns and return data in the same format as describe above under respective section.
Please note that any macro function will not work inside a stored procedure.
Examples
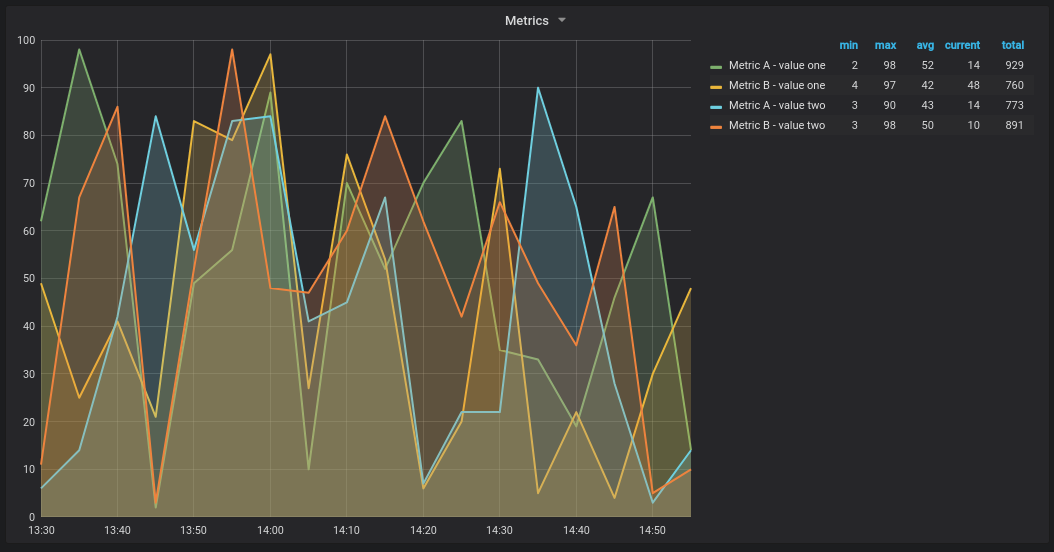
 For the following examples, the database table is defined in Time series queries. Let’s say that we want to visualize four series in a graph panel, such as all combinations of columns
 valueOne, valueTwo and measurement. Graph panel to the right visualizes what we want to achieve. To solve this, we need to use two queries:
First query:
SELECT
  $__timeGroup(time, '5m') as time,
  measurement + ' - value one' as metric,
  avg(valueOne) as valueOne
FROM
  metric_values
WHERE
  $__timeFilter(time)
GROUP BY
  $__timeGroup(time, '5m'),
  measurement
ORDER BY 1
Second query:
SELECT
  $__timeGroup(time, '5m') as time,
  measurement + ' - value two' as metric,
  avg(valueTwo) as valueTwo
FROM
  metric_values
GROUP BY
  $__timeGroup(time, '5m'),
  measurement
ORDER BY 1
Stored procedure using time in epoch format
We can define a stored procedure that will return all data we need to render 4 series in a graph panel like above. In this case the stored procedure accepts two parameters @from and @to of int data types which should be a timerange (from-to) in epoch format which will be used to filter the data to return from the stored procedure.
We’re mimicking the $__timeGroup(time, '5m') in the select and group by expressions, and that’s why there are a lot of lengthy expressions needed - these could be extracted to MS SQL functions, if wanted.
CREATE PROCEDURE sp_test_epoch(
  @from int,
  @to   int
)   AS
BEGIN
  SELECT
    cast(cast(DATEDIFF(second, {d '1970-01-01'}, DATEADD(second, DATEDIFF(second,GETDATE(),GETUTCDATE()), time))/600 as int)*600 as int) as time,
    measurement + ' - value one' as metric,
    avg(valueOne) as value
  FROM
    metric_values
  WHERE
    time >= DATEADD(s, @from, '1970-01-01') AND time <= DATEADD(s, @to, '1970-01-01')
  GROUP BY
    cast(cast(DATEDIFF(second, {d '1970-01-01'}, DATEADD(second, DATEDIFF(second,GETDATE(),GETUTCDATE()), time))/600 as int)*600 as int),
    measurement
  UNION ALL
  SELECT
    cast(cast(DATEDIFF(second, {d '1970-01-01'}, DATEADD(second, DATEDIFF(second,GETDATE(),GETUTCDATE()), time))/600 as int)*600 as int) as time,
    measurement + ' - value two' as metric,
    avg(valueTwo) as value
  FROM
    metric_values
  WHERE
    time >= DATEADD(s, @from, '1970-01-01') AND time <= DATEADD(s, @to, '1970-01-01')
  GROUP BY
    cast(cast(DATEDIFF(second, {d '1970-01-01'}, DATEADD(second, DATEDIFF(second,GETDATE(),GETUTCDATE()), time))/600 as int)*600 as int),
    measurement
  ORDER BY 1
END
Then we can use the following query for our graph panel.
DECLARE
  @from int = $__unixEpochFrom(),
  @to int = $__unixEpochTo()

EXEC dbo.sp_test_epoch @from, @to
Stored procedure using time in datetime format
We can define a stored procedure that will return all data we need to render 4 series in a graph panel like above. In this case the stored procedure accepts two parameters @from and @to of datetime data types which should be a timerange (from-to) which will be used to filter the data to return from the stored procedure.
We’re mimicking the $__timeGroup(time, '5m') in the select and group by expressions and that’s why there’s a lot of lengthy expressions needed - these could be extracted to MS SQL functions, if wanted.
CREATE PROCEDURE sp_test_datetime(
  @from datetime,
  @to   datetime
)   AS
BEGIN
  SELECT
    cast(cast(DATEDIFF(second, {d '1970-01-01'}, time)/600 as int)*600 as int) as time,
    measurement + ' - value one' as metric,
    avg(valueOne) as value
  FROM
    metric_values
  WHERE
    time >= @from AND time <= @to
  GROUP BY
    cast(cast(DATEDIFF(second, {d '1970-01-01'}, time)/600 as int)*600 as int),
    measurement
  UNION ALL
  SELECT
    cast(cast(DATEDIFF(second, {d '1970-01-01'}, time)/600 as int)*600 as int) as time,
    measurement + ' - value two' as metric,
    avg(valueTwo) as value
  FROM
    metric_values
  WHERE
    time >= @from AND time <= @to
  GROUP BY
    cast(cast(DATEDIFF(second, {d '1970-01-01'}, time)/600 as int)*600 as int),
    measurement
  ORDER BY 1
END
Then we can use the following query for our graph panel.
DECLARE
  @from datetime = $__timeFrom(),
  @to datetime = $__timeTo()

EXEC dbo.sp_test_datetime @from, @to