Use correlations in visualizations
Correlations in Logs Panel
-
Setup a correlation.
-
Open Explore.
-
Select a data source that you chose as the source data source of the correlation.
-
Run a query that results in data containing fields required to build variables in the target query.
-
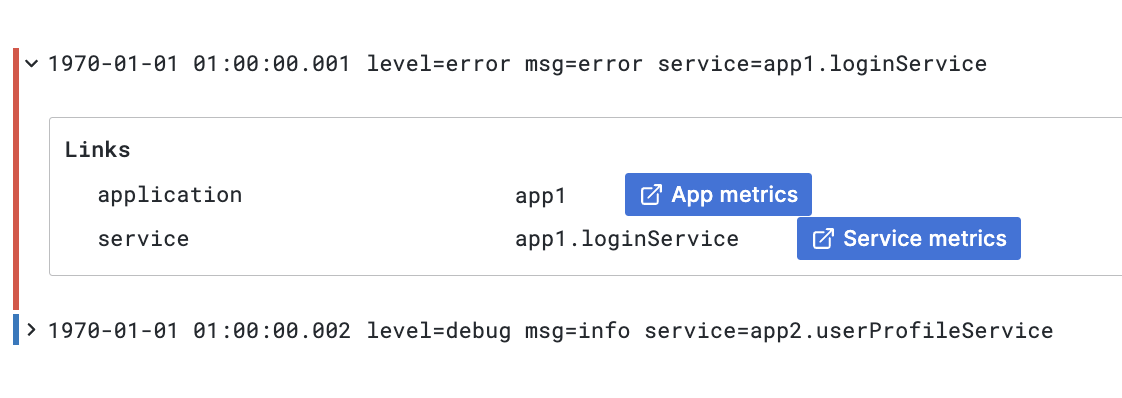
Expand log row details.
-
If the selected row contains all the information required to build the target query a link appears in the “Links” section at the bottom.
-
Additional information about used variables and their values is shown next to each link.
 Figure 1. Correlation links in Logs panel
Correlations in Table
-
Setup a correlation.
-
Open Explore.
-
Select a data source that you chose as the source data source of the correlation.
-
Run a query that results in data containing fields required to build variables in the target query.
-
Links are added to cell rows in the column representing the field with the assigned link (the results field.
-
Cells containing multiple links accessible with a context menu.
 Figure 2. Correlations links in table