Introduction to Alerting
Whether you’re just starting out or you’re a more experienced user of Grafana Alerting, learn more about the fundamentals and available features that help you create, manage, and respond to alerts; and improve your team’s ability to resolve issues quickly. For a hands-on introduction, refer to our tutorial to get started with Grafana Alerting.
Principles
In Prometheus-based alerting systems, you have an alert generator that creates alerts and an alert receiver that receives alerts. For example, Prometheus is an alert generator and is responsible for evaluating alert rules, while Alertmanager is an alert receiver and is responsible for grouping, inhibiting, silencing, and sending notifications about firing and resolved alerts.
Grafana Alerting is built on the Prometheus model of designing alerting systems. It has an internal alert generator responsible for scheduling and evaluating alert rules, as well as an internal alert receiver responsible for grouping, inhibiting, silencing, and sending notifications. Grafana doesn’t use Prometheus as its alert generator because Grafana Alerting needs to work with many other data sources in addition to Prometheus. However, it does use Alertmanager as its alert receiver.
Alerts are sent to the alert receiver where they are routed, grouped, inhibited, silenced and notified. In Grafana Alerting, the default alert receiver is the Alertmanager embedded inside Grafana, and is referred to as the Grafana Alertmanager. However, you can use other Alertmanagers too, and these are referred to as External Alertmanagers.
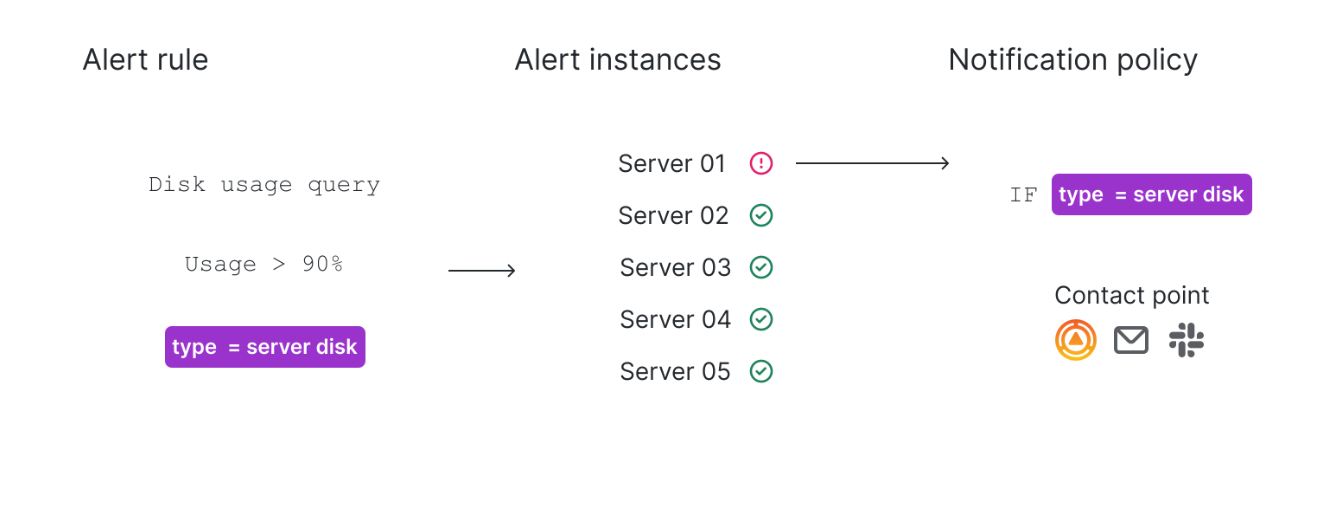
The following diagram gives you an overview of Grafana Alerting and introduces you to some of the fundamental features that are the principles of how Grafana Alerting works.

Fundamentals
Alert rules
An alert rule is a set of criteria that determine when an alert should fire. It consists of one or more queries and expressions, a condition which needs to be met, an interval which determines how often the alert rule is evaluated, and a duration over which the condition must be met for an alert to fire.
Alert rules are evaluated over their interval, and each alert rule can have zero, one, or any number of alerts firing at a time. The state of the alert rule is determined by its most “severe” alert, which can be one of Normal, Pending, or Firing. For example, if at least one of an alert rule’s alerts are firing then the alert rule is also firing. The health of an alert rule is determined by the status of its most recent evaluation. These can be OK, Error, and NoData.
A very important feature of alert rules is that they support custom annotations and labels. These allow you to instrument alerts with additional metadata such as summaries and descriptions, and add additional labels to route alerts to specific notification policies.
Alerts
Alerts are uniquely identified by sets of key/value pairs called Labels. Each key is a label name and each value is a label value. For example, one alert might have the labels foo=bar and another alert might have the labels foo=baz. An alert can have many labels such as foo=bar,bar=baz but it cannot have the same label twice such as foo=bar,foo=baz. Two alerts cannot have the same labels either, and if two alerts have the same labels such as foo=bar,bar=baz and foo=bar,bar=baz then one of the alerts will be discarded. Alerts are resolved when the condition in the alert rule is no longer met, or the alert rule is deleted.
In Grafana Managed Alerts, alerts can be in Normal, Pending, Alerting, No Data or Error states. In Datasource Managed Alerts, such as Mimir and Loki, alerts can be in Normal, Pending and Alerting, but not NoData or Error.
Contact points
Contact points determine where notifications are sent. For example, you might have a contact point that sends notifications to an email address, to Slack, to an incident management system (IRM) such as Grafana OnCall or Pagerduty, or to a webhook.
The notifications that are sent from contact points can be customized using notification templates. You can use notification templates to change the title, message, and structure of the notification. Notification templates are not specific to individual integrations or contact points.
Notification policies
Notification policies group alerts and then route them to contact points. They determine when notifications are sent, and how often notifications should be repeated.
Alerts are matched to notification policies using label matchers. These are human-readable expressions that assert if the alert’s labels exactly match, do not exactly match, contain, or do not contain some expected text. For example, the matcher foo=bar matches alerts with the label foo=bar while the matcher +foo=~` matches alerts with any label called foo with a value that matches the regular expression `+[a-zA-Z].
By default, an alert can only match one notification policy. However, with the continue feature alerts can be made to match any number of notification policies at the same time. For more information on notification policies, see fundamentals of Notification Policies.
Silences and mute timings
Silences and mute timings allow you to pause notifications for specific alerts or even entire notification policies. Use a silence to pause notifications on an ad-hoc basis, such as during a maintenance window; and use mute timings to pause notifications at regular intervals, such as evenings and weekends.