Histogram
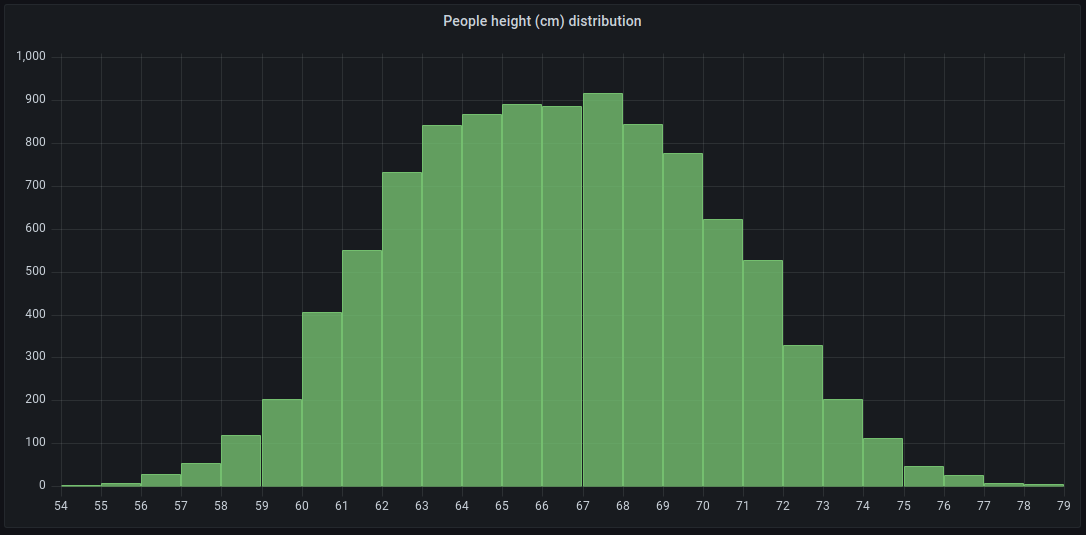
Histograms calculate the distribution of values and present them as a bar chart. Each bar represents a bucket; the y-axis and the height of each bar represent the count of values that fall into each bucket, and the x-axis represents the value range.
For example, if you want to understand the distribution of people’s heights, you can use a histogram visualization to identify patterns or insights in the data distribution:
You can use a histogram visualization if you need to:
-
Visualize and analyze data distributions over a specific time range to see how frequently certain values occur.
-
Identify any outliers in your data distribution.
-
Provide statistical analysis to help with decision-making
Configure a histogram visualization
Once you’ve created a dashboard, the following video shows you how to configure a histogram visualization:
Supported data formats
Histograms support time series and any table results with one or more numerical fields.
Examples
The following tables are examples of the type of data you need for a histogram visualization and how it should be formatted.
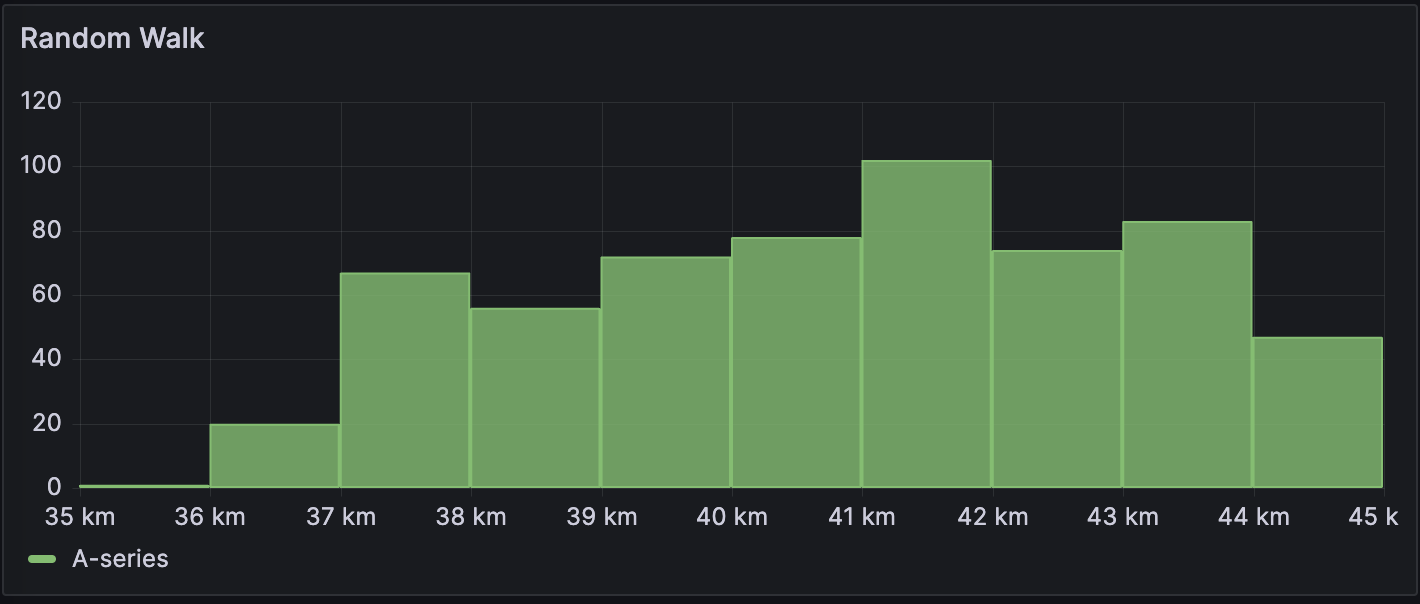
Time-series table
| Time | Walking (km) |
|---|---|
2024-03-25 21:13:09 |
37.2 |
2024-03-25 21:13:10 |
37.1 |
2024-03-25 21:13:10 |
37.0 |
2024-03-25 21:13:11 |
37.2 |
2024-03-25 21:13:11 |
36.9 |
2024-03-25 21:13:12 |
36.7 |
2024-03-25 21:13:13 |
36.3 |
The data is converted as follows:
Histogram options
Use the following options to refine your histogram visualization.
Bucket size
The size of the buckets. Leave this empty for automatic bucket sizing (~10% of the full range).
Bucket offset
If the first bucket should not start at zero. A non-zero offset has the effect of shifting the aggregation window. For example, 5-sized buckets that are 0-5, 5-10, 10-15 with a default 0 offset would become 2-7, 7-12, 12-17 with an offset of 2; offsets of 0, 5, or 10, in this case, would effectively do nothing. Typically, this option would be used with an explicitly defined bucket size rather than automatic. For this setting to affect, the offset amount should be greater than 0 and less than the bucket size; values outside this range will have the same effect as values within this range.
Gradient mode
Set the mode of the gradient fill. Fill gradient is based on the line color. To change the color, use the standard color scheme field option.
Gradient display is influenced by the Fill opacity setting.
Legend options
Unresolved directive in histogram.adoc - include::{root_path}shared/visualizations/legend-options-1.adoc[]
Value mappings
Unresolved directive in histogram.adoc - include::../{root_path}shared/visualizations/value-mappings-options.adoc[]
Thresholds
Unresolved directive in histogram.adoc - include::../{root_path}shared/visualizations/thresholds-options-2.adoc[]