Tracing in Explore
You can use Explore to query and visualize traces from tracing data sources.
Supported data sources are:
-
Tempo (supported ingestion formats: OpenTelemetry, Jaeger, and Zipkin)
For information on how to configure queries for the data sources listed above, refer to the documentation for specific data source.
Query editor
You can query and search tracing data using a data source’s query editor.
Each data source can have it’s own query editor. The query editor for the Tempo data source is slightly different than the query editor for the Jaeger data source.
For information on querying each data source, refer to their documentation:
Trace view
This section explains the elements of the Trace View.
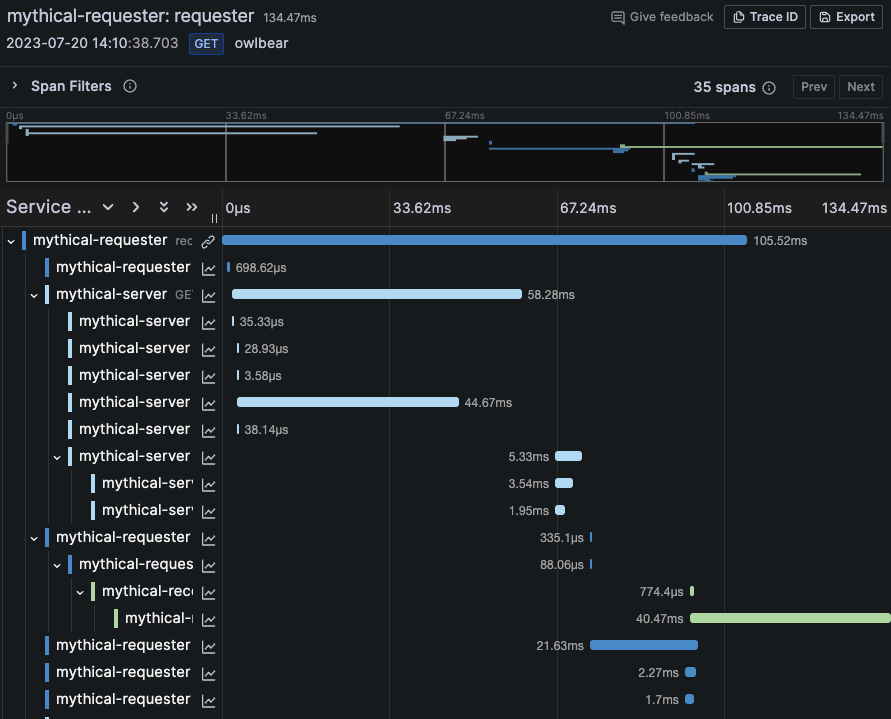
Header

-
Header title: Shows the name of the root span and trace ID.
-
Search: Highlights spans containing the searched text.
-
Metadata: Various metadata about the trace.
Minimap

Shows condensed view or the trace timeline. Drag your mouse over the minimap to zoom into smaller time range. Zooming will also update the main timeline, so it is easy to see shorter spans. Hovering over the minimap, when zoomed, will show Reset Selection button which resets the zoom.
Span filters
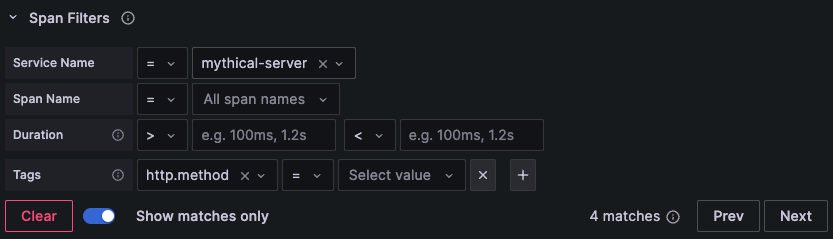
Using span filters, you can filter your spans in the trace timeline viewer. The more filters you add, the more specific are the filtered spans.
You can add one or more of the following filters:
-
Resource service name
-
Span name
-
Duration
-
Tags (which include tags, process tags, and log fields)
To only show the spans you have matched, you can press the Show matches only toggle.
Timeline
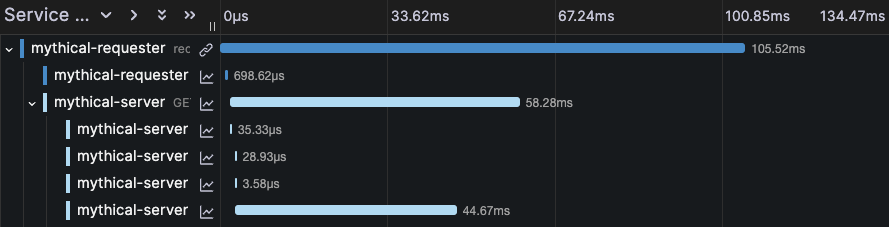
Shows list of spans within the trace. Each span row consists of these components:
-
Expand children button: Expands or collapses all the children spans of selected span.
-
Service name: Name of the service logged the span.
-
Operation name: Name of the operation that this span represents.
-
Span duration bar: Visual representation of the operation duration within the trace.
Clicking anywhere on the span row shows span details.
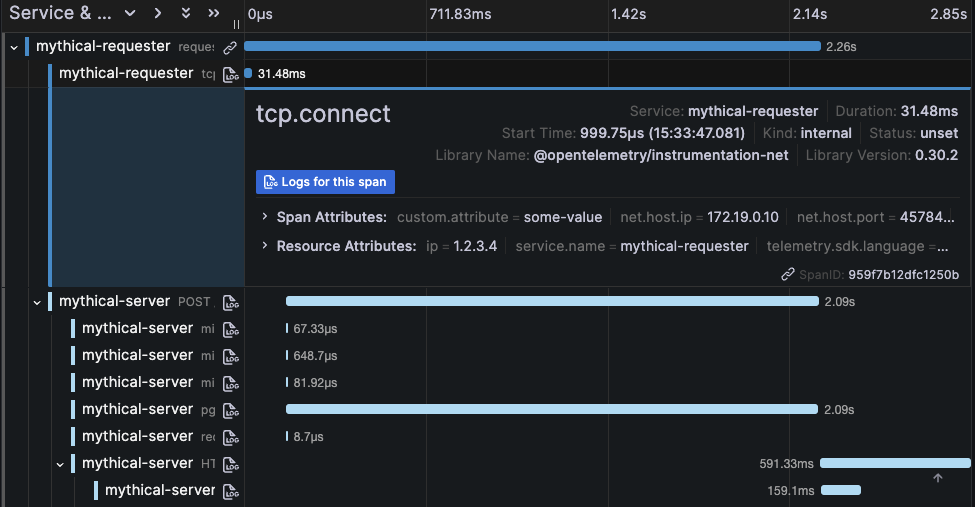
Span details
image::screenshot-grafana-trace-view-span-details.png
-
Operation name.
-
Span metadata.
-
Tags: Any tags associated with this span.
-
Process metadata: Metadata about the process that logged this span.
-
Logs: List of logs logged by this span and associated key values. In case of Zipkin logs section shows Zipkin annotations.
Trace to logs
You can navigate from a span in a trace view directly to logs relevant for that span. This feature is available for Tempo, Jaeger, and Zipkin data sources. Refer to their relevant documentation for configuration instructions.
Click the document icon to open a split view in Explore with the configured data source and query relevant logs for the span.
Trace to metrics
NOTE: This feature is currently in beta and behind the
traceToMetricsfeature toggle.
You can navigate from a span in a trace view directly to metrics relevant for that span. This feature is available for Tempo, Jaeger, and Zipkin data sources. Refer to their relevant documentation for configuration instructions.
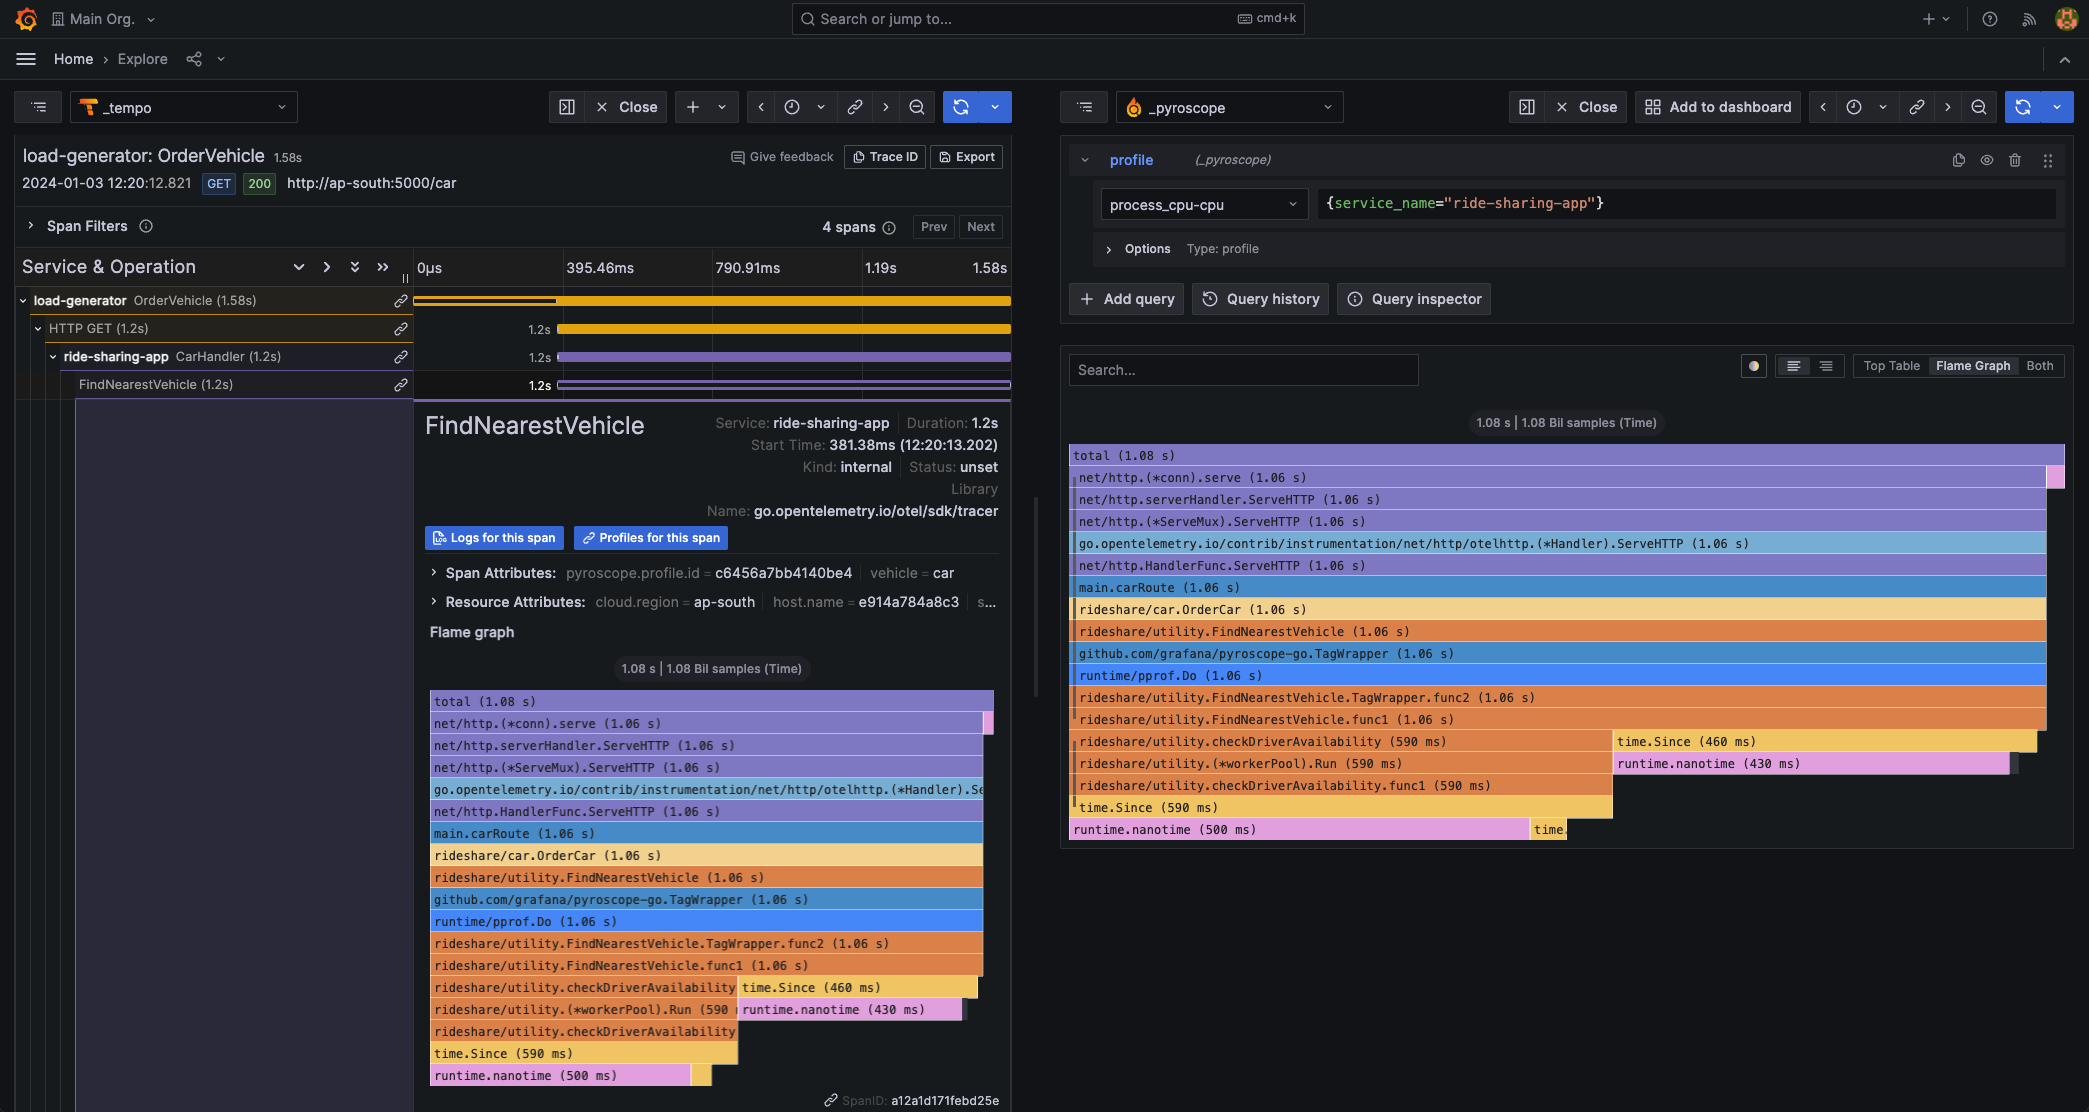
Trace to profiles
Using Trace to profiles, you can use Grafana’s ability to correlate different signals by adding the functionality to link between traces and profiles. Refer to the relevant documentation for configuration instructions.
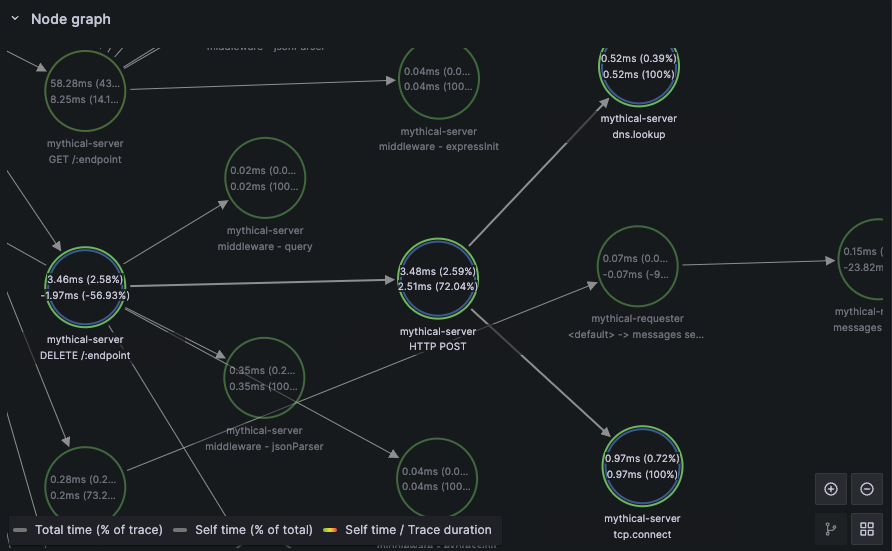
Node graph
You can optionally expand the node graph for the displayed trace. Depending on the data source, this can show spans of the trace as nodes in the graph, or as some additional context like service graph based on the current trace.
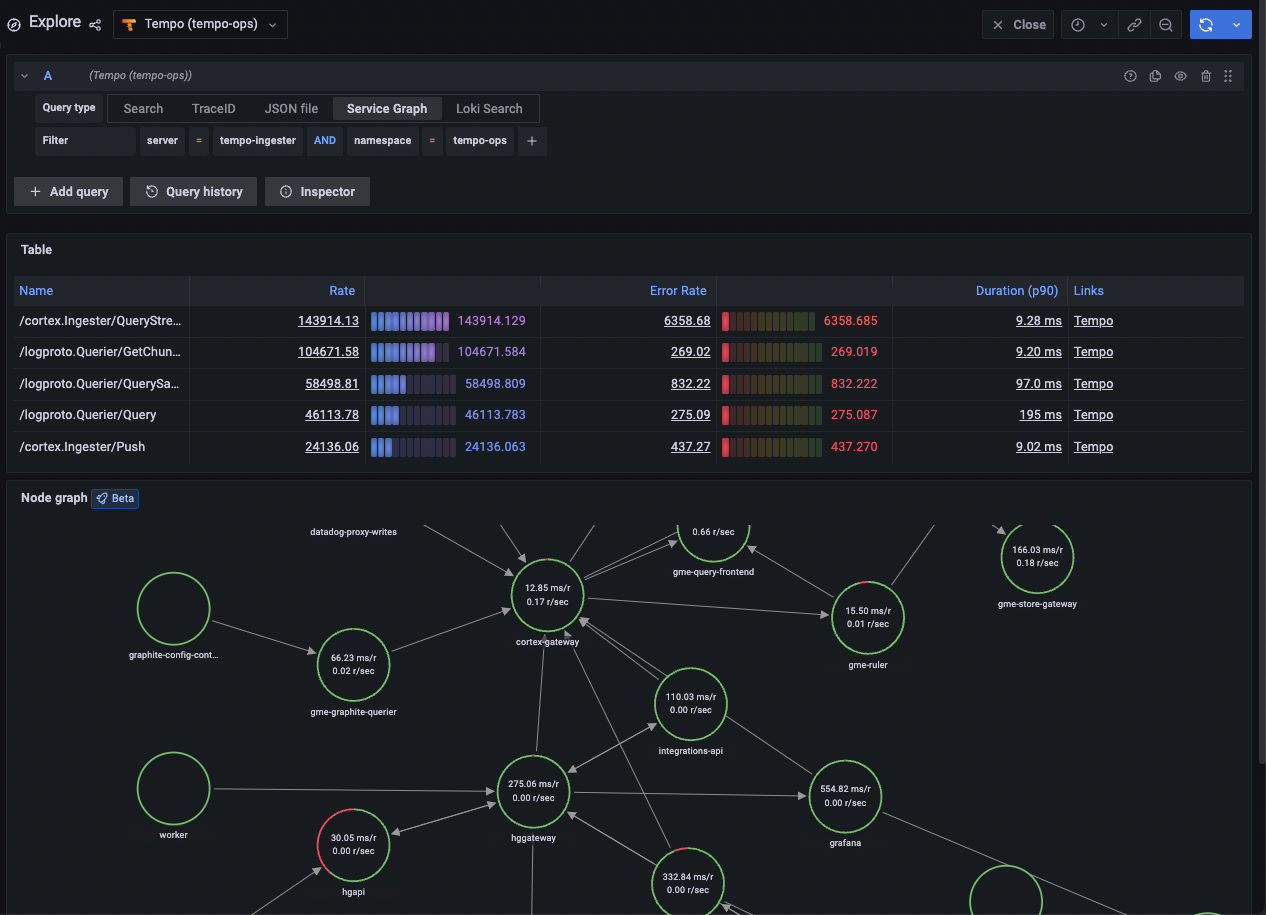
Service Graph
The Service Graph visualizes the span metrics (traces data for rates, error rates, and durations (RED)) and service graphs. Once the requirements are set up, this pre-configured view is immediately available.
For more information, refer to the Service Graph view section of the Tempo data source page and the service graph view page in the Tempo documentation.
Data API
This visualization needs a specific shape of the data to be returned from the data source in order to correctly display it.
Data source needs to return data frame and set frame.meta.preferredVisualisationType = 'trace'.
Data frame structure
Required fields:
| Field name | Type | Description |
|---|---|---|
traceID |
string |
Identifier for the entire trace. There should be only one trace in the data frame. |
spanID |
string |
Identifier for the current span. SpanIDs should be unique per trace. |
parentSpanID |
string |
SpanID of the parent span to create child parent relationship in the trace view. Can be |
serviceName |
string |
Name of the service this span is part of. |
serviceTags |
TraceKeyValuePair[] |
List of tags relevant for the service. |
startTime |
number |
Start time of the span in millisecond epoch time. |
duration |
number |
Duration of the span in milliseconds. |
Optional fields:
| Field name | Type | Description |
|---|---|---|
logs |
TraceLog[] |
List of logs associated with the current span. |
tags |
TraceKeyValuePair[] |
List of tags associated with the current span. |
warnings |
string[] |
List of warnings associated with the current span. |
stackTraces |
string[] |
List of stack traces associated with the current span. |
errorIconColor |
string |
Color of the error icon in case span is tagged with |
For details about the types see TraceSpanRow, TraceKeyValuePair and TraceLog.