Use variables and transformations in a correlation
Before you begin
This example walks through creating a link in a test data source but the same principles apply to any data source.
The example emulates a scenario with two data sources:
-
Logs containing lines in the format: “2020-01-01 10:00 level=error message=error service=app1.loginService” stored in a field named “msg”
-
Metrics for application included in the service name of a log line (e.g. app1)
Instructions below show how to set up a link that can run metrics query for the host included in each log line with provisioning and regex transformation. Additionally, a link with a query containing the full name of the service is set up to demonstrate the logfmt transformation.
Use variables and transformations in provisioning
-
Add the following provisioning configuration to your Grafana:
datasources:
  - name: Target
    uid: test-target
    type: testdata

  - name: Source
    uid: test-source
    type: testdata
  - name: Source
    uid: test-source
    type: testdata
    correlations:
      - targetUID: test-target
        label: App metrics
        description: Application HTTP request metrics
        config:
          type: query
          target:
            scenario_id: random_walk
            alias: $${application}
          field: msg
          transformations:
            - type: regex
              field: msg
              expression: service=(\w+)\.\w+
              mapValue: application
      - targetUID: test-target
        label: Service metrics
        description: Service metrics
        config:
          type: query
          target:
            scenario_id: random_walk
            alias: $${service}
          field: msg
          transformations:
            - type: logfmt
              field: msg
Two data sources are created: Source (emulating logs data source) and Target (emulating metrics data source): * A correlation called “App metrics” is created targeting the Target data source with its UID. The label and description are provided as text Each correlation contains the following configuration: * Required correlation type (query) * Target query matching test data source model “App metrics” correlation contains the following configuration: * Alias is set to ${application} variable (note that in provisioning files $ is used to access environment variables so it has to be escaped). * Regular expression transformation is created to extract values from “msg” field Regular expression transformation is used to capture the application name from the full name of the service stored in the log line. The output of the transformation is mapped to a variable called “application”. “Service metrics” correlation is created in a similar way but with logfmt transformation to break down log message and access full name of the service (e.g. “app1.loginService”). * For example, when a logline “2020-01-01 10:00 level=error message=error service=app1.loginService” is provided as the input, the transformation produces new variables: level, message, and service. * “service” variable is used as the alias in the target query.
-
Navigate to Explore and open “Source” data source.
-
Select the “Raw Frames” scenario and provide the following data frames to emulate returning log lines:
[ { "meta": { "preferredVisualisationType": "logs" }, "fields": [ { "name": "time", "values": [1, 2] }, { "name": "msg", "values": [ "level=error msg=error service=app1.loginService", "level=debug msg=info service=app2.userProfileService" ] } ] } ] -
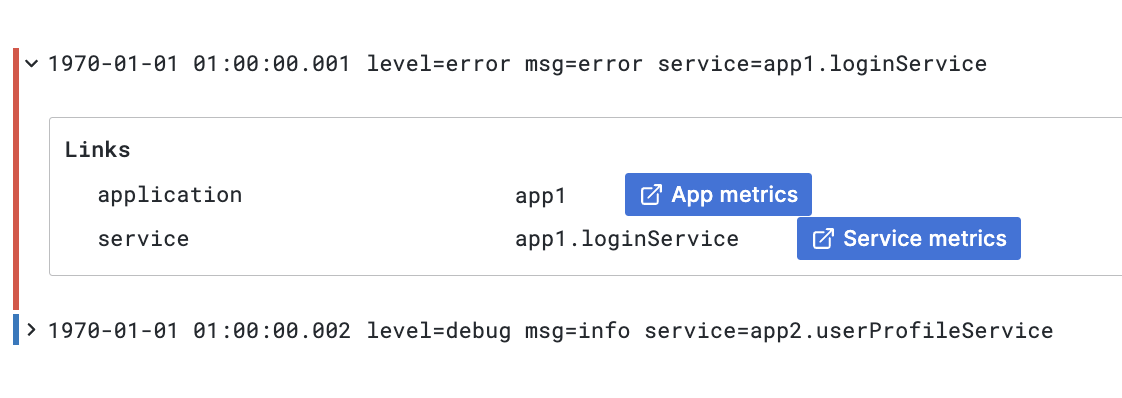
Run the query and open log details by clicking on the log line.
 Figure 1. Correlation links in Logs panel
A link “App metrics” and “Service metrics” show next to variables extracted out of the log line with transformations
-
Click on the “App metrics” link.
-
A split view is opened and the target query is run.
-
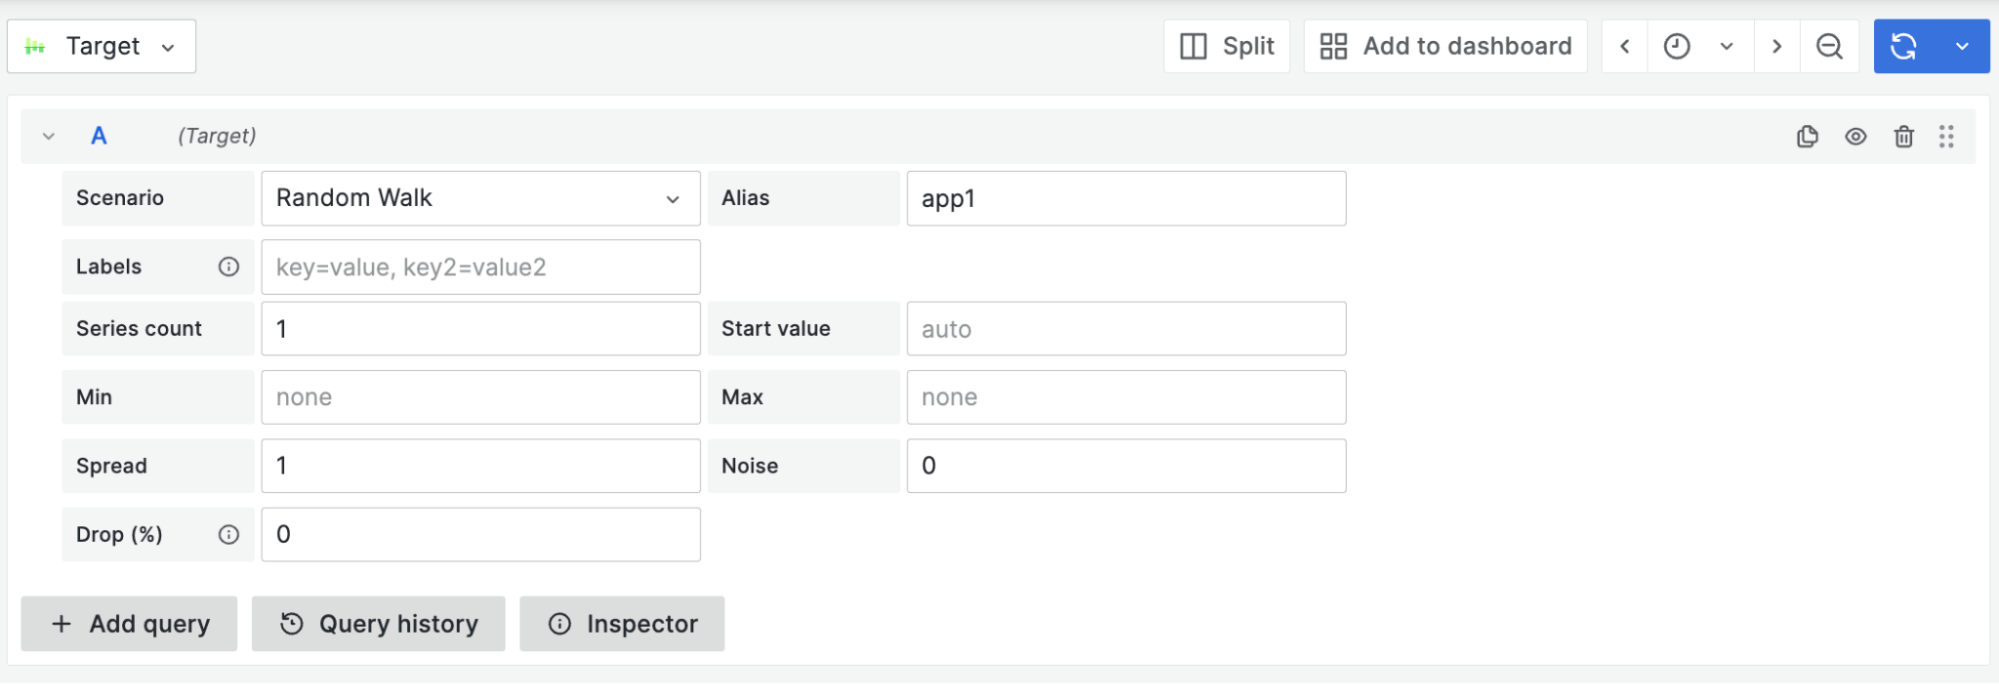
Notice how the application name from the log line is filled in as the alias property in the target query.
 Figure 2. Interpolated target query
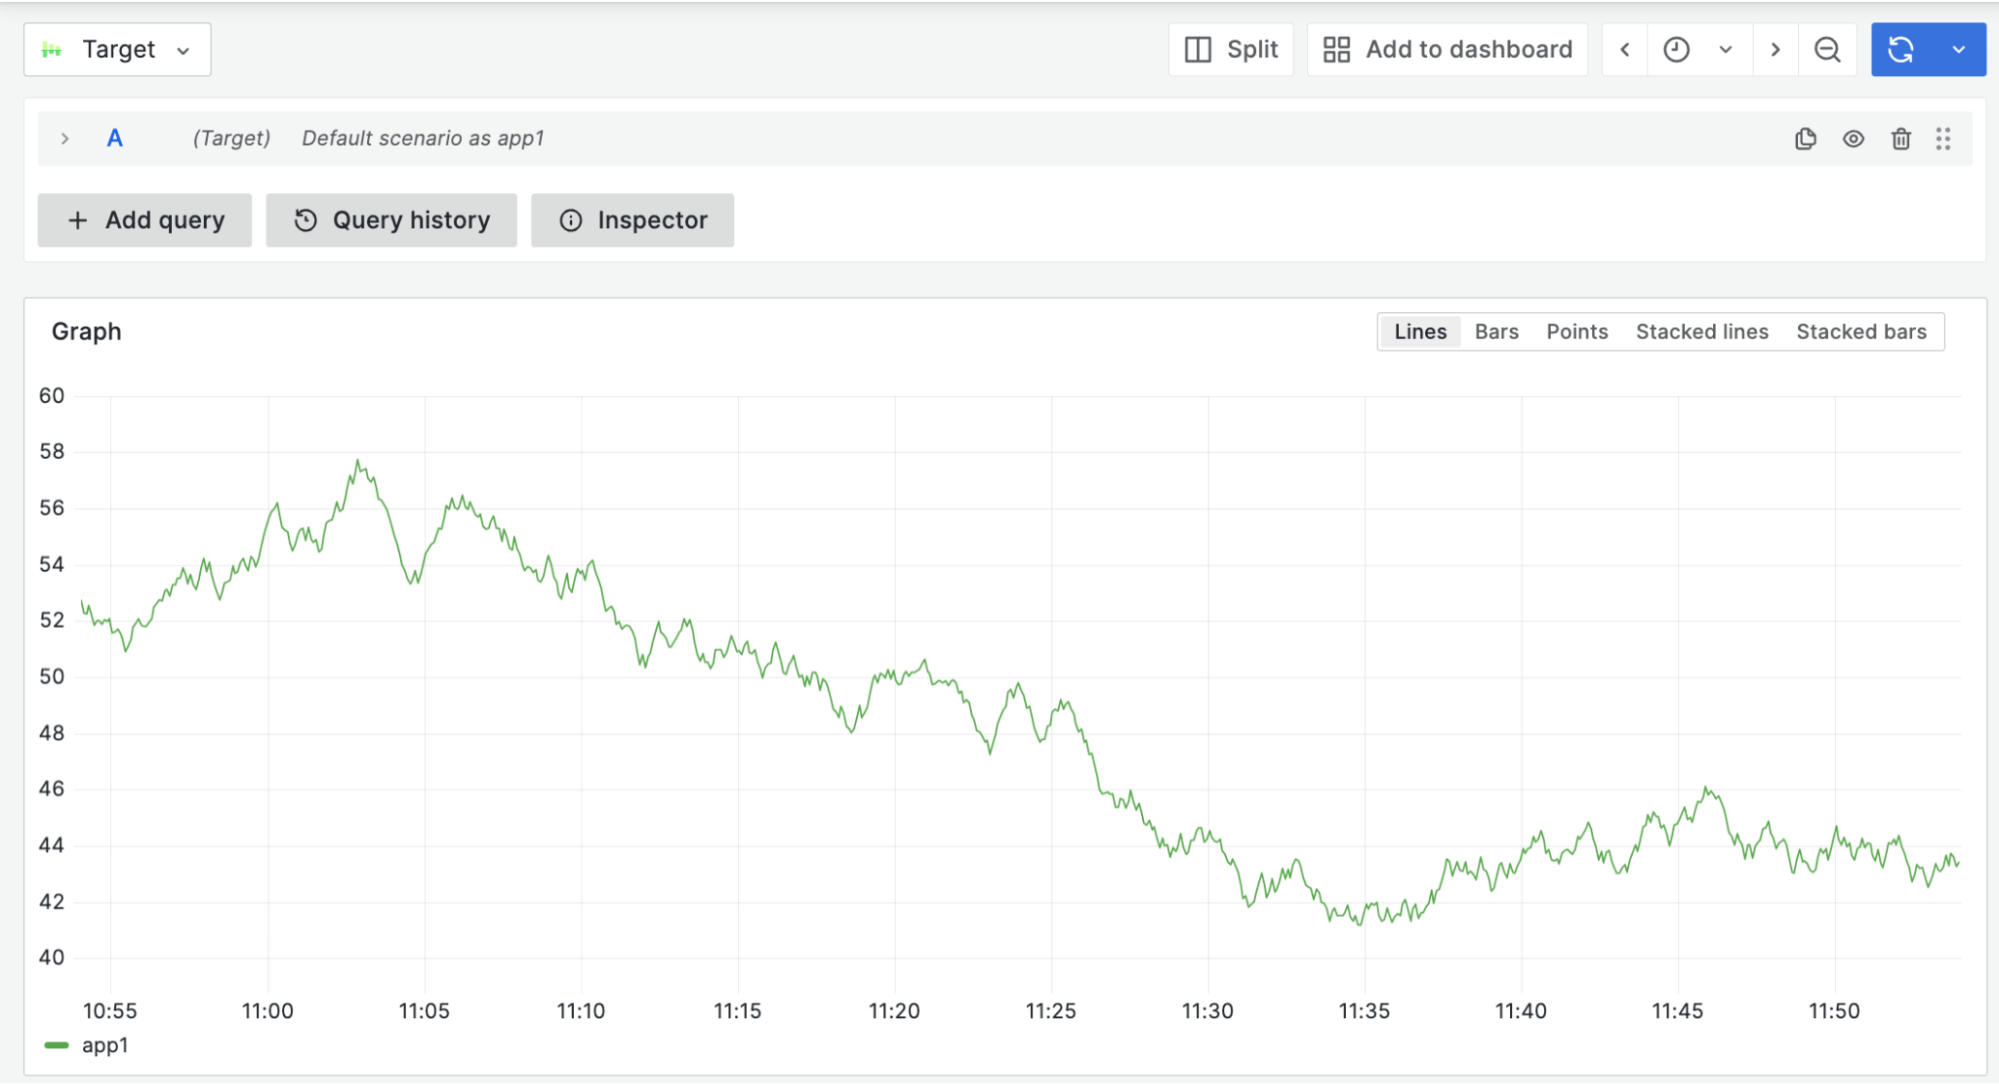
This allows you to run a specific query based on the source results:
 Figure 3. Interpolated target query results
 -
Go back to the source query and change raw frames’ preferred visualization type to “table” to see how links are displayed in a Table visualization.
[ { "meta": { "preferredVisualisationType": "table" }, "fields": [...] } ] -
Run the query and notice how links are created in the Table cell:
 Figure 4. Correlations links in table