Correlations Editor in Explore
NOTE: The Explore editor is available in 10.1 and later versions. In the editor, transformations is available in Grafana 10.3 and later versions.
Correlations allow users to build a link between any two data sources. For more information about correlations in general, please see the correlations topic in the administration page.
Create a correlation
-
In Grafana, navigate to the Explore page.
-
Select a data source that you would like to be the source data source for a new correlation.
-
Run a query producing data in a supported visualization.
-
Click + Add in the top toolbar and select Add correlation (you can also select Correlations Editor from the Command Palette).
-
Explore is now in Correlations Editor mode indicated by a blue border and top bar. You can exit Correlations Editor by clicking Exit in the top bar.
-
You can now create the following new correlations for the visualization with links that are attached to the data that you can use to build a new query:
-
Logs: links are displayed next to field values inside log details for each log row
-
Table: every table cell is a link
-
-
Click on a link to add a new correlation. Links are associated with a field that is used as a result field of a correlation.
-
In the split view that opens, use the right pane to set up the target query source of the correlation.
-
Build a target query using variables syntax with variables from the list provided at the top of the pane. The list contains sample values from the selected data row.
-
Provide a label and description (optional). A label will be used as the name of the link inside the visualization and can contain variables.
-
Provide transformations (optional; see below for details).
-
Click Save in the top toolbar to save the correlation and exit Correlations Editor mode. The link used to create the correlation is replaced with a data link in each row. When the link is clicked, the query you defined will run in another pane, with the variables replaced dynamically with the values from the selected row.
Transformations
Transformations allow you to extract values that exist in a field with other data. For example, using a transformation, you can extract one portion of a log line to use in a correlation. For more details on transformations in correlations, see Correlations.
After clicking one of the generated links in the editor mode, you can add transformations by clicking Add transformation in the Transformations dropdown menu.
You can use a transformation in your correlation with the following steps:
-
Select a field to apply the transformation to. Select the portion of the field that you want to use for the transformation. For example, a log line. Once selected, the value of this field will be used to assist you in building the transformation.
-
Select the type of the transformation. See correlations for the options and relevant settings.
-
Based on your selection, you might see one or more variables populate, or you might need to provide more specifications in options that are displayed.
-
Select Add transformation to correlation to add the specified variables to the list of available variables.
Notes for regular expressions
For regular expressions in this dialog box, the mapValue referred to in other documentation is called Variable Name here. Grafana highlights any text that matches the expression in the field value. Use regular expression capture groups to select what portion of the match should be extracted. When a valid regular expression is provided, the variable and the value of that variable appear below the Variable Name field.
Correlations examples
The following examples show how to create correlations using the Correlations Editor in Explore. If you’d like to follow these examples, make sure to set up a test data source.
Create a text to graph correlation
This example shows how to create a correlation using Correlations Editor in Explore.
Correlations allow you to use results of one query to run a new query in any data source. In this example, you will run a query that renders tabular data. The data will be used to run a different query that yields a graph result.
To follow this example, make sure you have set up a test data source.
-
In Grafana, navigate to Explore.
-
Select the test data source from the dropdown menu at the top left of the page.
-
Click + Add in the dropdown menu to the right and select Add correlation.
-
Explore is now in Correlations Editor mode, indicated by a blue border.
-
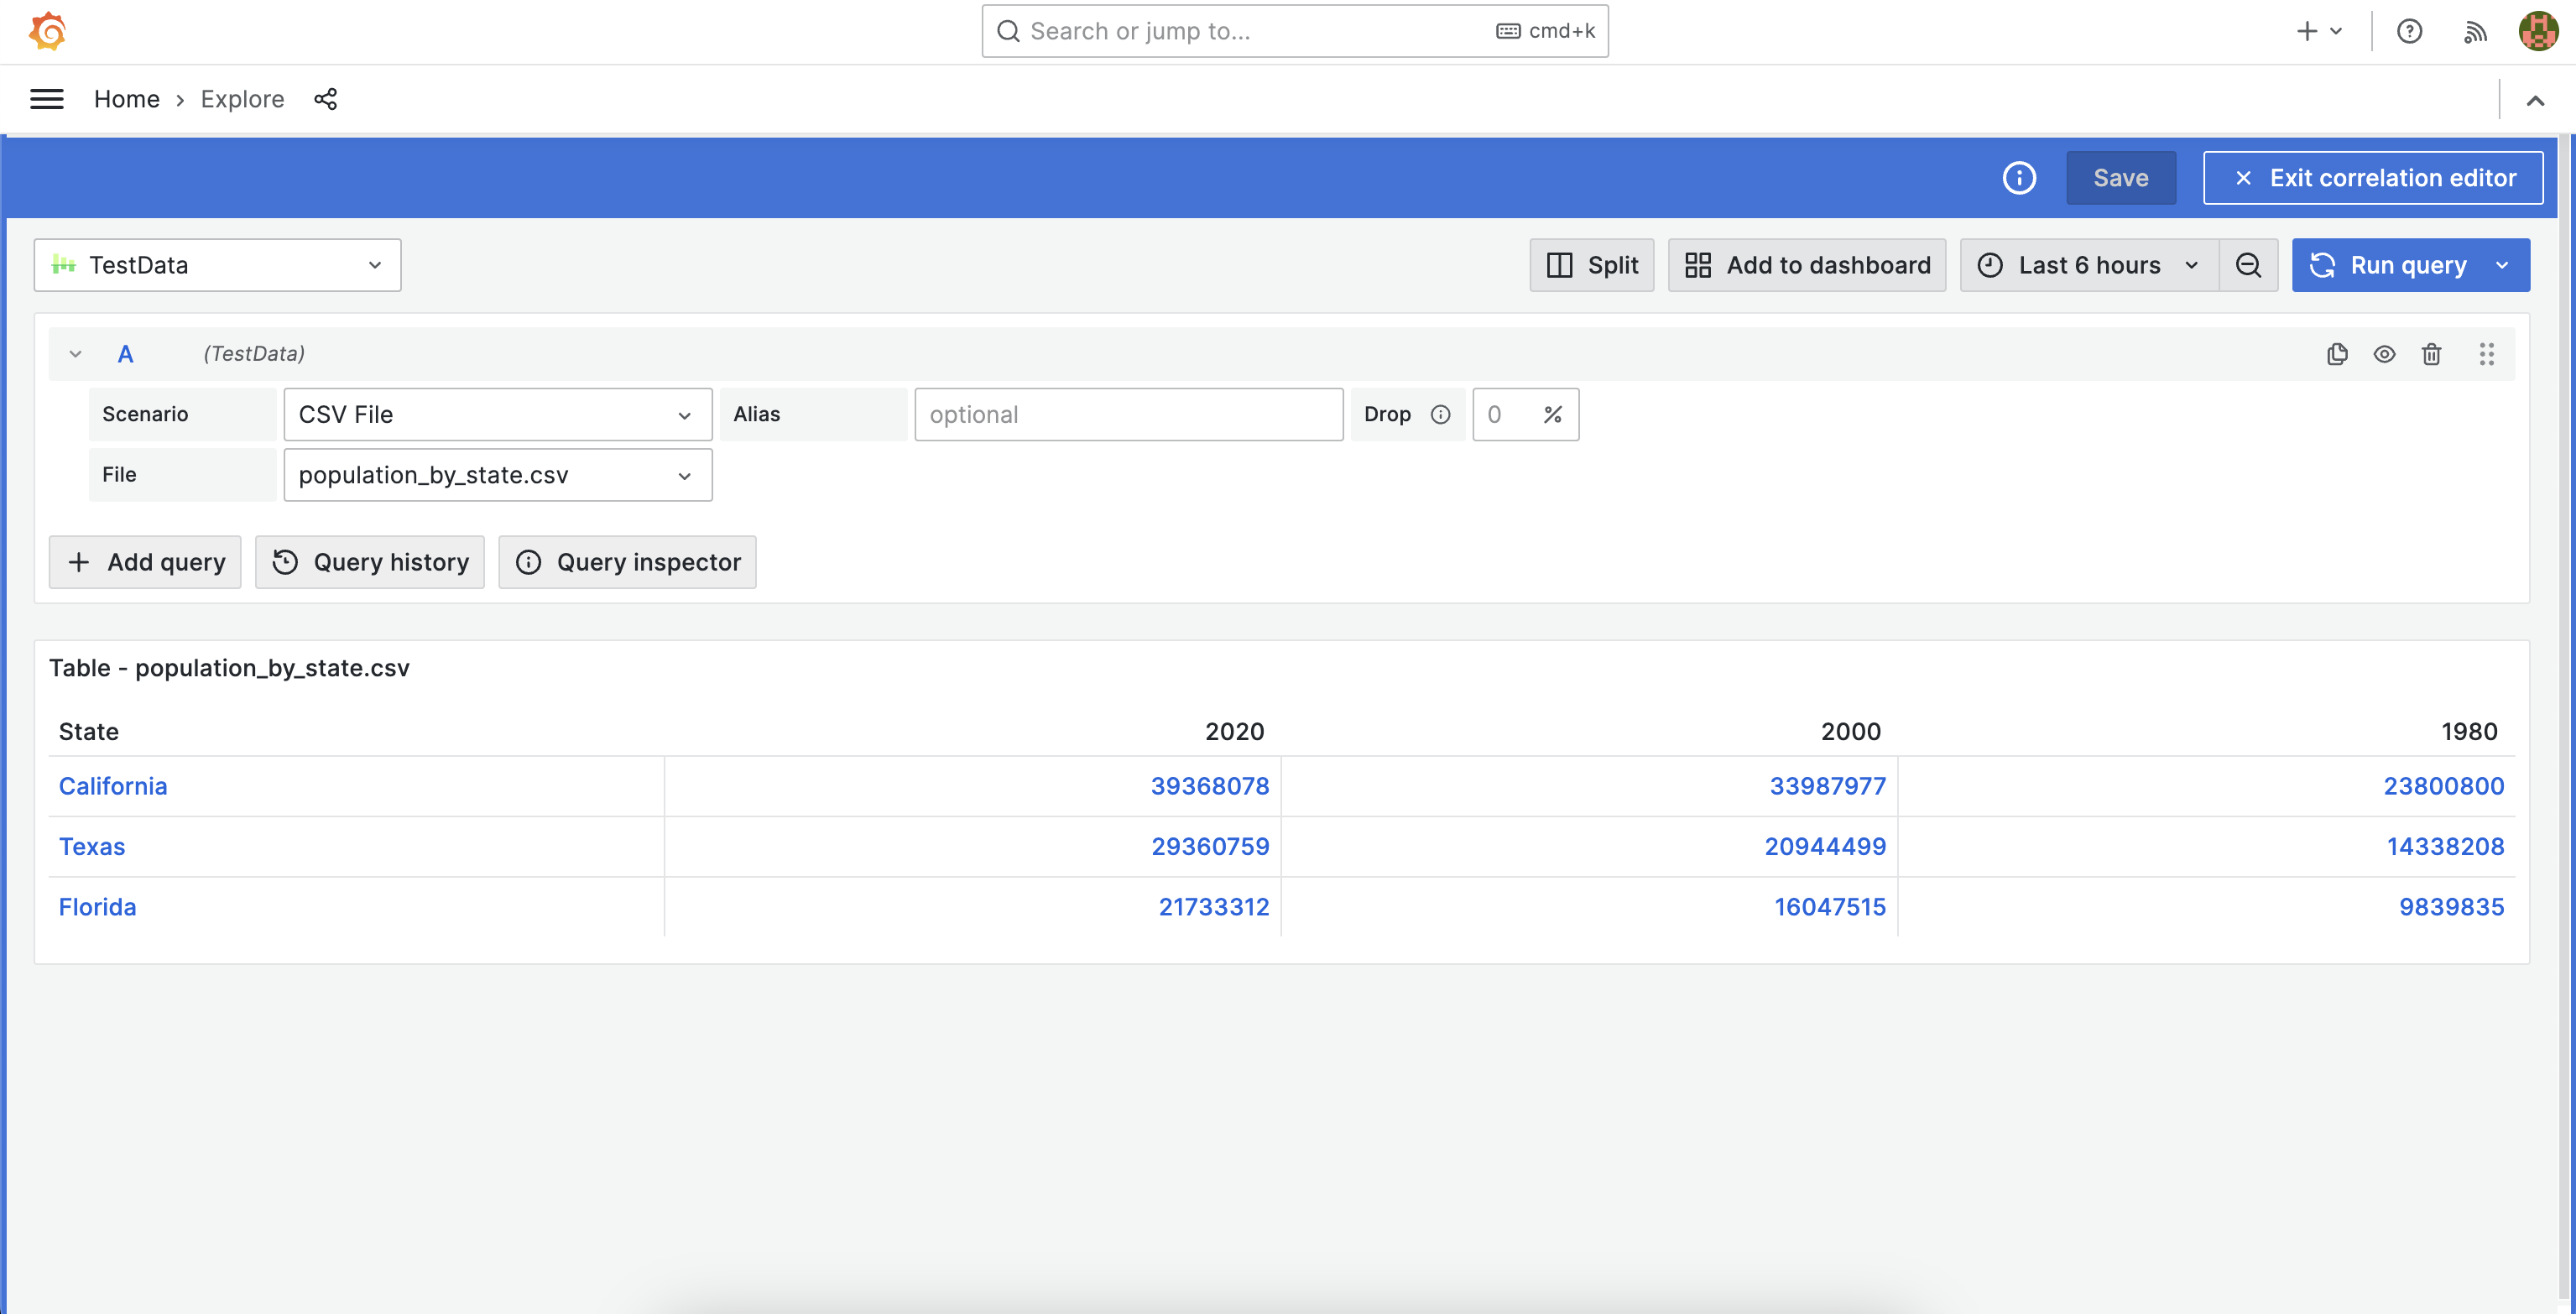
Select the following scenario from the scenario dropdown menu: CSV File.
-
Select the file, population_by_state.csv. Each cell is a link that you can click on to begin creating a new correlation.
 Figure 1. Selecting the source of a correlation
 -
Click on any cell in the
Statecolumn to create a new correlation that attaches a data link to that entry. For example, select “California”. -
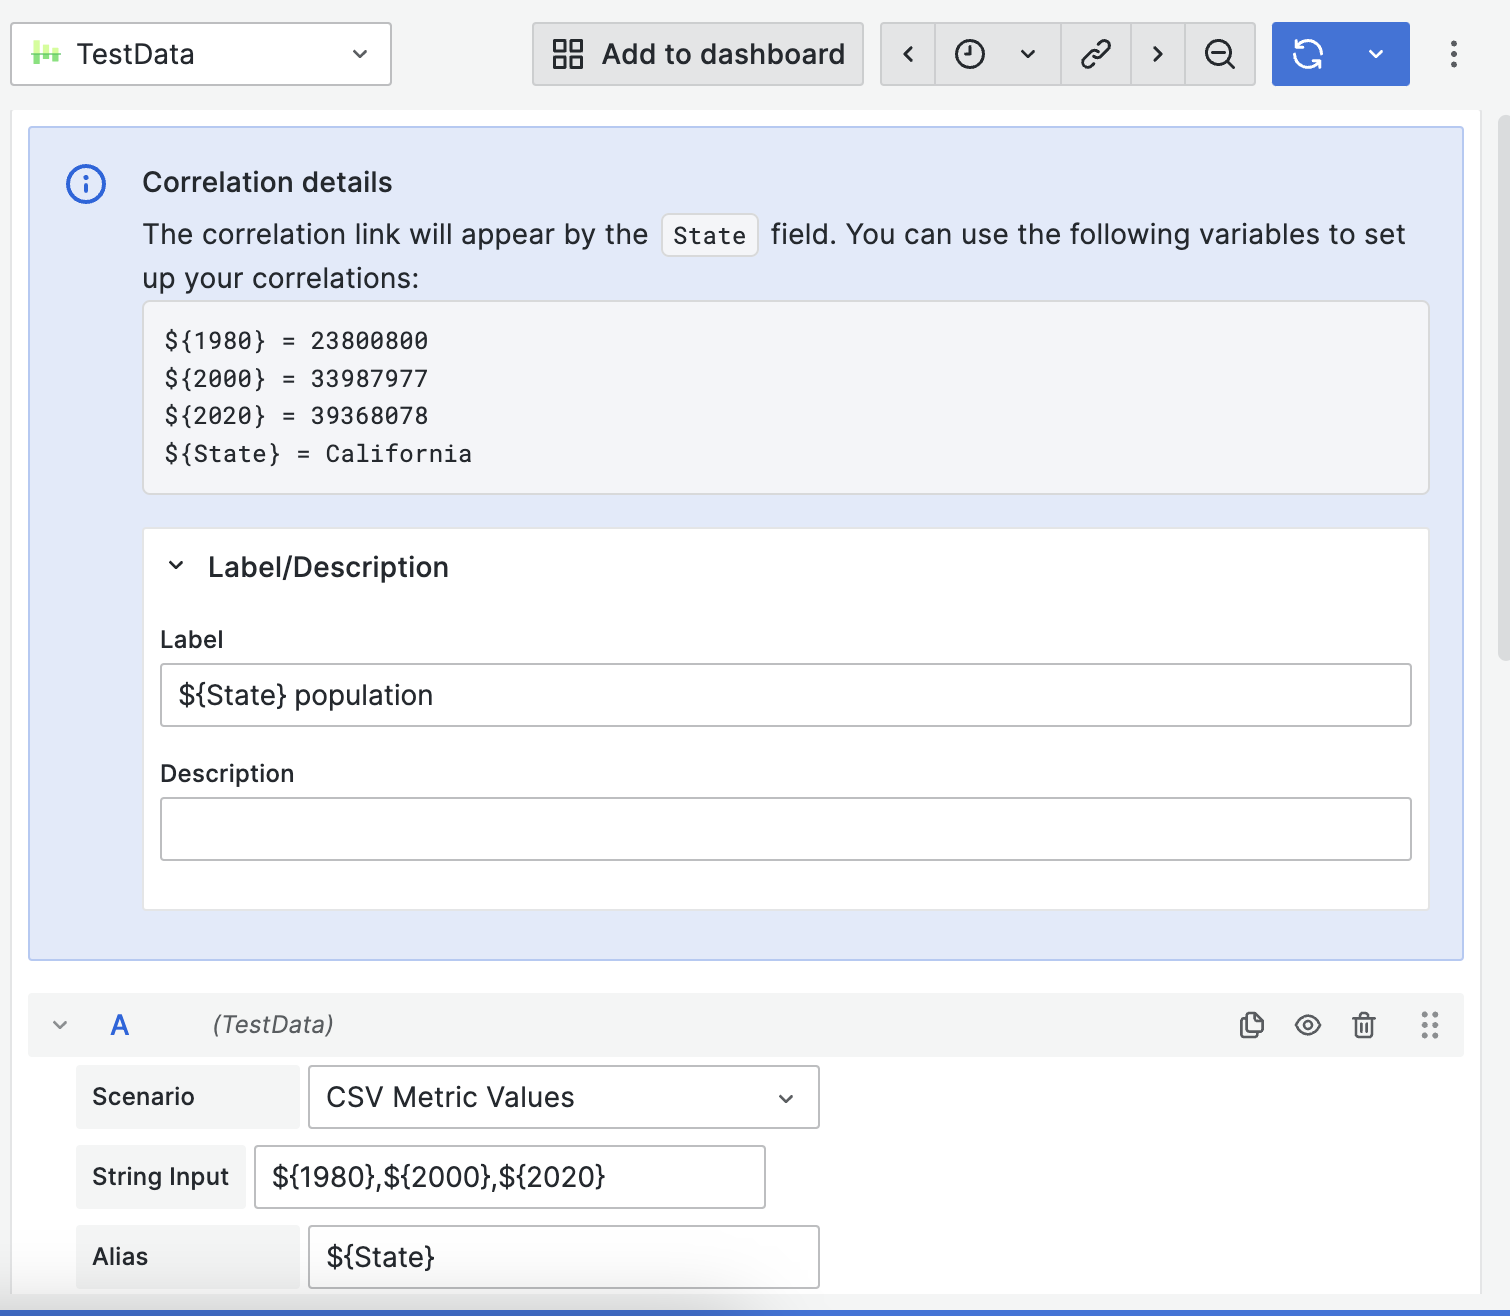
In the split view, select the same data source you selected in the left pane. The helper above the query editor contains all available variables you can use the target query. Variables contain all data fields (table columns) from the selected row.
-
In the Scenario menu, select CSV Metric Values. The
String Inputfield in the Query editor provides variables with population values for each year:${1980},${2000},${2020}. This will generate a graph using variable values. -
In the Query Editor Alias field, enter “${State}”.
 Figure 2. Setting up the target of a correlation
Run a query to see that it produces a graph using sample values from the variables.
-
Click Save to save the correlation and exit the Correlations Editor.
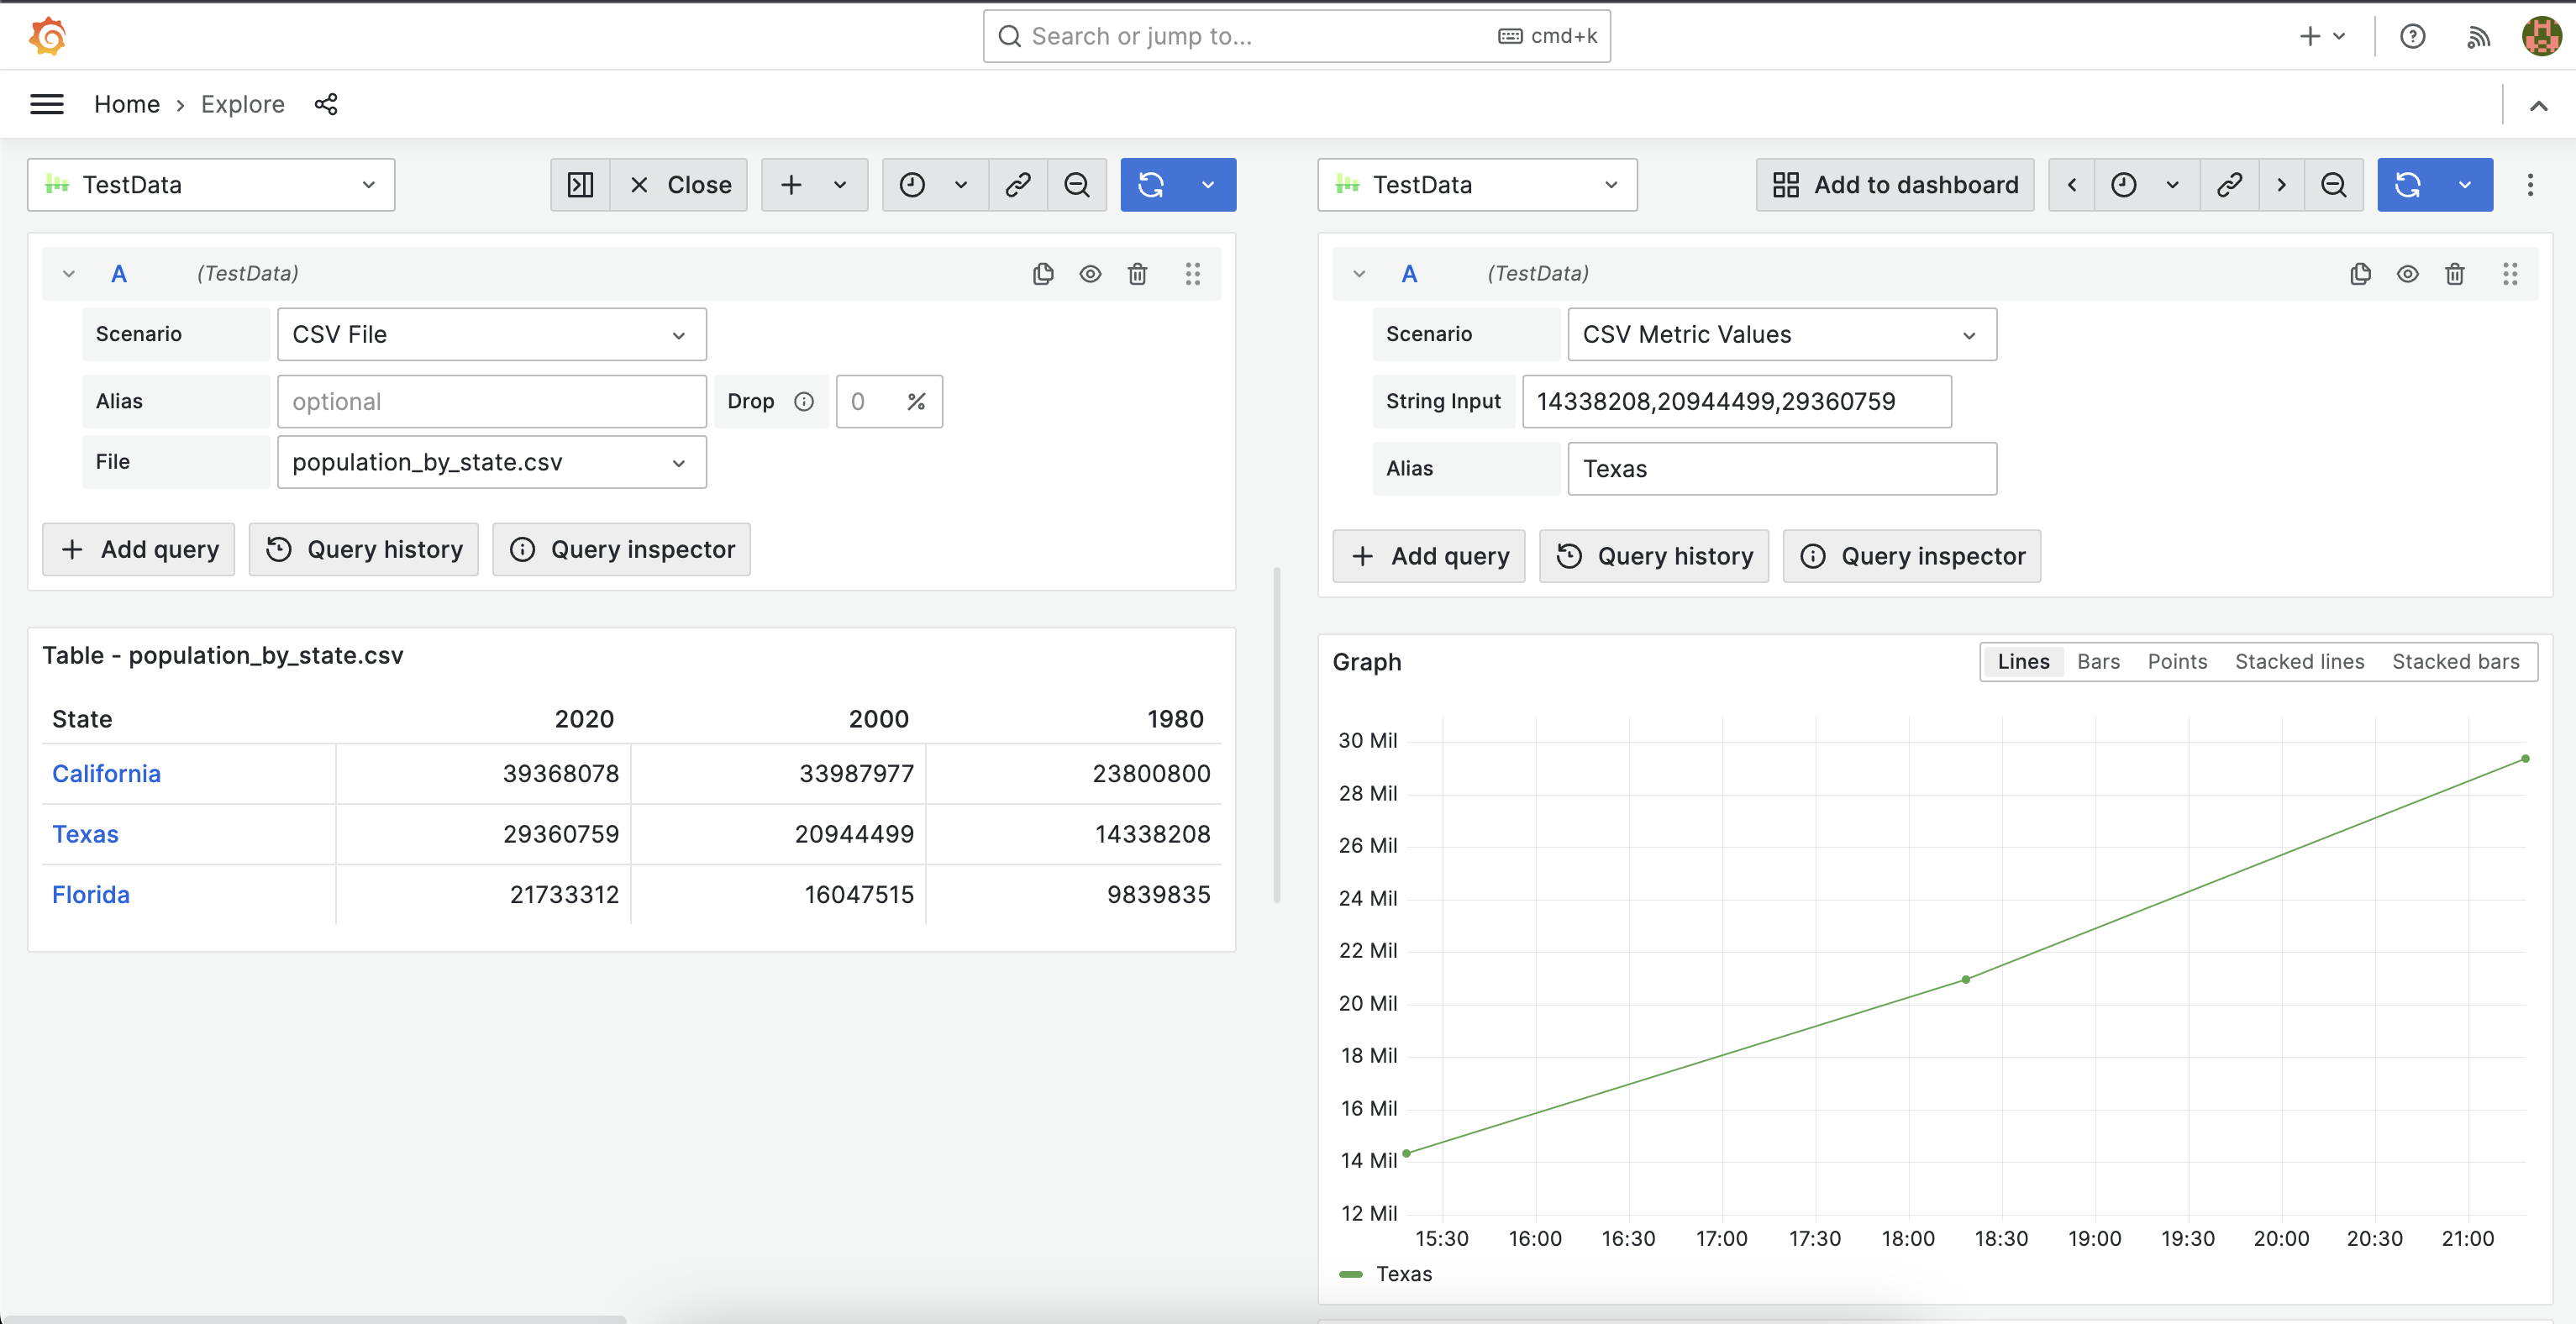
After the correlation is saved, Explore will rerun the query in the left pane. By clicking a state name, the query on the right is rerun with values from the row being inserted into the CSV, thus changing the graph. The query is rerun with updated values every time you click on a state name.
 Figure 3. Result of clicking on a data link
You can apply the same steps to any data source. Correlations allow you to create links in visualizations to run dynamic queries based on selected data. In this example we used data returned by a query to build a new query generating different visualization using the same data source. However, you can create correlations between any data sources to create custom exploration flows.
Create a logs to table correlation
In this example, you will create a correlation to demonstrate how to use transformations to extract values from the log line and another field.
To follow this example, make sure you have set up a test data source.
-
In Grafana, navigate to Explore.
-
Select the test data source from the dropdown menu at the top left of the page.
-
Click + Add in the dropdown menu to the right and select Add correlation.
-
Explore is now in Correlations Editor mode, indicated by a blue border.
-
In the Scenario menu, select Logs.
-
Expand a log line to see the correlation links. Select
Correlate with hostname. -
Explore opens in split view. Select the same data source you selected in the left pane. The helper above the query editor contains all available variables you can use the target query.
-
Expand the transformations section, and click Add transformation.
-
In the Field dropdown menu, select message. The log line shows up as example data.
-
Under Type, select Logfmt. This populates the list of variables.
-
Click Add transformation to correlation.
-
Click Add transformation again and under Field, select hostname.
-
Under Type, select Regular expression.
-
Under Expression, enter the following:
-([0-9]\*)This selects any numbers to the right of the dash. -
Under Variable Name, enter the following: hostNumber This populates the list of variables.
-
Click Add transformation to correlation to add it to the other variables.
-
In the data source editor, open the Scenario dropdown menu and select CSV Content.
-
In the text box below, provide the following and save the correlation:
time,msg,hostNumber,status
${time},${msg},${hostNumber},${status}
This closes the split view and reruns the left query. Expand any log line to see the correlation button. Clicking the correlation button opens the split view with the
time(a field),msg(extracted withlogfmtfrom the log line), host number (extracted withregexfrom thehostname) and thestatus(extracted withlogfmtfrom the log line).