Grafana data sources
Grafana comes with built-in support for many data sources. If you need other data sources, you can also install one of the many data source plugins. If the plugin you need doesn’t exist, you can develop a custom plugin.
Each data source comes with a query editor, which formulates custom queries according to the source’s structure. After you add and configure a data source, you can use it as an input for many operations, including:
This documentation describes how to manage data sources in general, and how to configure or query the built-in data sources. For other data sources, refer to the list of datasource plugins.
To develop a custom plugin, refer to Create a data source plugin.
Manage data sources
Only users with the organization administrator role can add or remove data sources. To access data source management tools in Grafana as an administrator, navigate to Configuration > Data Sources in the Grafana sidebar.
For details on data source management, including instructions on how configure user permissions for queries, refer to the administration documentation.
Add a data source
Before you can create your first dashboard, you need to add your data source.
NOTE: Only users with the organization admin role can add data sources.
To add a data source:
-
Click Connections in the left-side menu.
-
Enter the name of a specific data source in the search dialog. You can filter by Data source to only see data sources.
-
Click the data source you want to add.
-
Configure the data source following instructions specific to that data source.
Use query editors

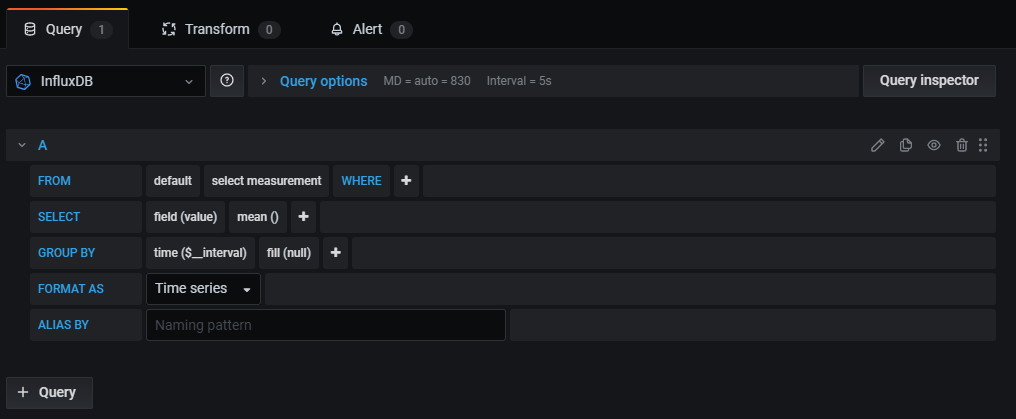
Each data source’s query editor provides a customized user interface that helps you write queries that take advantage of its unique capabilities. You use a data source’s query editor when you create queries in dashboard panels or Explore.
Because of the differences between query languages, each data source query editor looks and functions differently. Depending on your data source, the query editor might provide auto-completion features, metric names, variable suggestions, or a visual query-building interface.
For example, this video demonstrates the visual Prometheus query builder:
For general information about querying in Grafana, and common options and user interface elements across all query editors, refer to Query and transform data.
Special data sources
Grafana includes three special data sources:
Grafana
A built-in data source that generates random walk data and can poll the Testdata data source. Additionally, it can list files and get other data from a Grafana installation. This can be helpful for testing visualizations and running experiments.
Mixed
An abstraction that lets you query multiple data sources in the same panel. When you select Mixed, you can then select a different data source for each new query that you add.
-
The first query uses the data source that was selected before you selected Mixed.
-
You can’t change an existing query to use the Mixed data source.
Built-in core data sources
These built-in core data sources are also included in the Grafana documentation:
Add additional data source plugins
You can add additional data sources as plugins (that are not available in core Grafana), which you can install or create yourself.
Find data source plugins in the plugin catalog
To view available data source plugins, go to the plugin catalog and select the “Data sources” filter. For details about the plugin catalog, refer to Plugin management.
You can further filter the plugin catalog’s results for data sources provided by the Grafana community, Grafana Labs, and partners. If you use Grafana Enterprise, you can also filter by Enterprise-supported plugins.
For more documentation on a specific data source plugin’s features, including its query language and editor, refer to its plugin catalog page.
Create a data source plugin
To build your own data source plugin, refer to the Build a data source plugin tutorial and Plugin tools.