Loki query editor
The Loki data source’s query editor helps you create log and metric queries that use Loki’s query language, LogQL.
For general documentation on querying data sources in Grafana, refer to Query and transform data.
Choose a query editing mode
The Loki query editor has two modes:
-
Builder mode, which provides a visual query designer.
-
Code mode, which provides a feature-rich editor for writing queries.
To switch between the editor modes, select the corresponding Builder and Code tabs.
To run a query, select Run queries located at the top of the editor.
NOTE: To run Loki queries in Explore, select Run query.
Each mode is synchronized, so you can switch between them without losing your work, although there are some limitations. Builder mode doesn’t support some complex queries. When you switch from Code mode to Builder mode with such a query, the editor displays a warning message that explains how you might lose parts of the query if you continue. You can then decide whether you still want to switch to Builder mode.
You can also augment queries by using template variables.
Toolbar elements
The query editor toolbar contains the following elements:
-
Kick start your query - Click to see a list of queries that help you quickly get started creating LogQL queries. You can then continue to complete your query.
These include:
-
Log query starters
-
Metric query starters
Click the arrow next to each to see available query options.
-
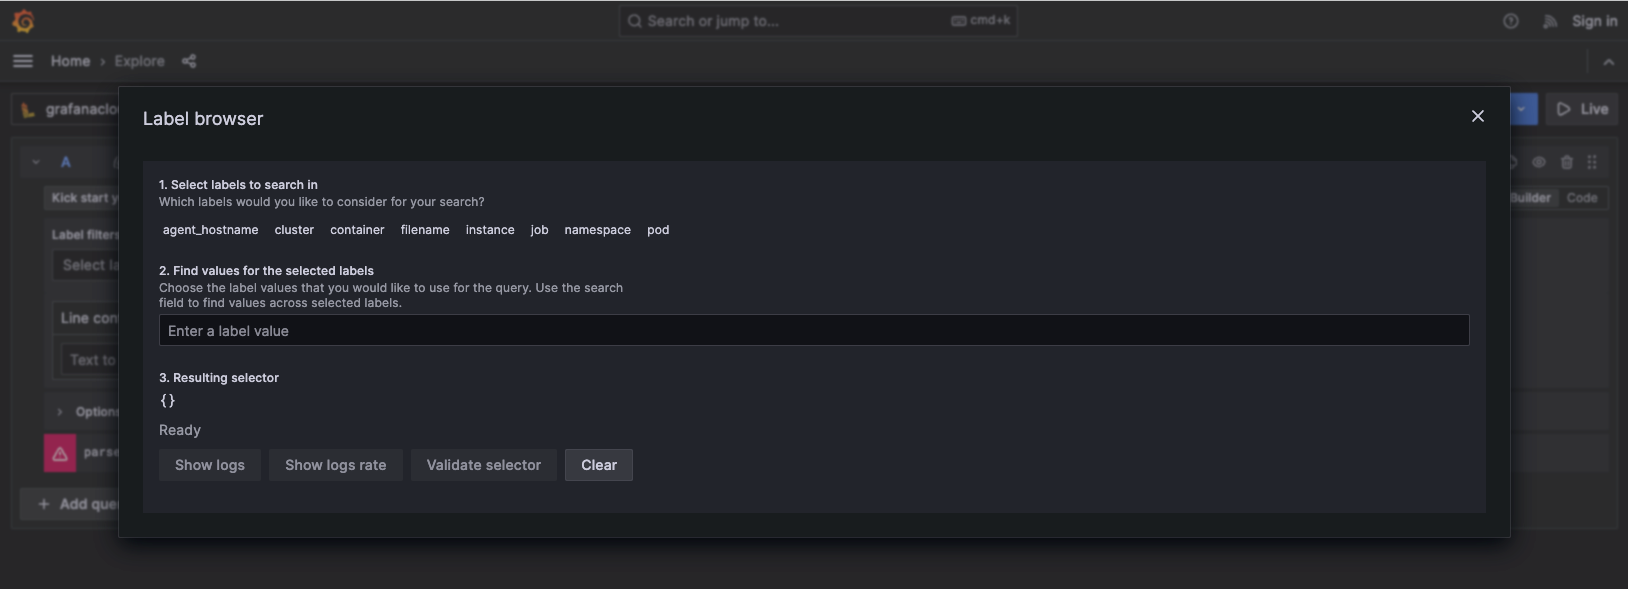
Label browser - Use the Loki label browser to navigate through your labels and values, and build queries.
To navigate Loki and build a query:
-
Choose labels to locate.
-
Search for the values of your selected labels.
The search field supports fuzzy search, and the label browser also supports faceting to list only possible label combinations.
-
Select the Show logs button to display log lines based on the selected labels, or select the Show logs rate button to show the rate based on metrics such as requests per second. Additionally, you can validate the selector by clicking the Validate selector button. Click Clear to start from the beginning.

-
Explain query - Toggle to display a step-by-step explanation of all query components and operations.

-
Builder/Code - Click the corresponding Builder or Code tab on the toolbar to select an editor mode.
Builder mode
Builder mode helps you build queries using a visual interface without needing to manually enter LogQL. This option is best for users who have limited or no previous experience working with Loki and LogQL.
Label filters
Select labels and their values from the dropdown list. When you select a label, Grafana retrieves available values from the server.
Use the + button to add a label and the x button to remove a label. You can add multiple labels.
Select comparison operators from the following options:
-
=- equal to -
!=- is not equal -
=~- matches regex -
!~- does not match regex
Select values by using the dropdown, which displays all possible values based on the label selected.
Operations
Select the + Operations button to add operations to your query. The query editor groups operations into related sections, and you can type while the operations dropdown is open to search and filter the list.
The query editor displays a query’s operations as boxes in the operations section. Each operation’s header displays its name, and additional action buttons appear when you hover your cursor over the header:
| Button | Action |
|---|---|
|
Replaces the operation with different operation of the same type. |
|
Opens the operation’s description tooltip. |
|
Removes the operation. |
The query editor groups operations into the following sections:
-
Aggregations - see Built-in aggregation operators
-
Range functions - see Range Vector aggregation
-
Formats - see Log queries
-
Binary operations - see Binary operators
-
Label filters - see Label filter expression
-
Line filters - see Line filter expression
Some operations make sense only when used in a specific order. If adding an operation would result in nonsensical query, the query editor adds the operation to the correct place. To re-order operations manually, drag the operation box by its name and drop it into the desired place. For additional information see Order of operations.
Code mode
In Code mode, you can write complex queries using a text editor with autocompletion feature, syntax highlighting, and query validation. It also contains a label browser to further help you write queries.
For more information about Loki’s query language, refer to the Loki documentation.
Options
The following options are the same for both Builder and Code mode:
-
Legend - Controls the time series name, using a name or pattern. For example,
{{hostname}}is replaced with the label value for the labelhostname. -
Type - Selects the query type to run. The
instanttype queries against a single point in time. We use the “To” time from the time range. Therangetype queries over the selected range of time. -
Line limit -Defines the upper limit for the number of log lines returned by a query. The default is
1000 -
Step Sets the step parameter of Loki metrics queries. The default value equals to the value of
$__intervalvariable, which is calculated using the time range and the width of the graph (the number of pixels). -
Resolution Deprecated. Sets the step parameter of Loki metrics range queries. With a resolution of
1/1, each pixel corresponds to one data point.1/2retrieves one data point for every other pixel,1/10retrieves one data point per 10 pixels, and so on. Lower resolutions perform better.
Create a log query
Loki log queries return the contents of the log lines. You can query and display log data from Loki via Explore, and with the Logs panel in dashboards.
To display the results of a log query, select the Loki data source, then enter a LogQL query.
For more information about log queries and LogQL, refer to the Loki log queries documentation.
Show log context
In Explore, you can can retrieve the context surrounding your log results by clicking the Show Context button. You’ll be able to investigate the logs from the same log stream that came before and after the log message you’re interested in.
The initial log context query is created from all labels defining the stream for the selected log line. You can use the log context query editor to widen the search by removing one or more of the label filters from log stream. Additionally, if you used a parser in your original query, you can refine your search by using extracted labels filters.
To reduce the repetition of selecting and removing the same labels when examining multiple log context windows, Grafana stores your selected labels and applies them to each open context window. This lets you seamlessly navigate through various log context windows without having to reapply your filters.
To reset filters and use the initial log context query, click the Revert to initial query button next to the query preview.
Tail live logs
Loki supports live tailing of logs in real-time in Explore.
Live tailing relies on two Websocket connections: one between the browser and Grafana server, and another between the Grafana server and Loki server.
To start tailing logs click the Live button in the top right corner of the Explore view. 
Proxying examples
If you use reverse proxies, configure them accordingly to use live tailing:
Using Apache2 for proxying between the browser and the Grafana server:
ProxyPassMatch "^/(api/datasources/proxy/\d+/loki/api/v1/tail)" "ws://127.0.0.1:3000/$1"
Using NGINX:
This example provides a basic NGINX proxy configuration. It assumes that the Grafana server is available at http://localhost:3000/, the Loki server is running locally without proxy, and your external site uses HTTPS. If you also host Loki behind an NGINX proxy, repeat the following configuration for Loki.
In the http section of NGINX configuration, add the following map definition:
  map $http_upgrade $connection_upgrade {
    default upgrade;
    '' close;
  }
In your server section, add the following configuration:
  location ~ /(api/datasources/proxy/\d+/loki/api/v1/tail) {
      proxy_pass          http://localhost:3000$request_uri;
      proxy_set_header    Host              $host;
      proxy_set_header    X-Real-IP         $remote_addr;
      proxy_set_header    X-Forwarded-for   $proxy_add_x_forwarded_for;
      proxy_set_header    X-Forwarded-Proto "https";
      proxy_set_header    Connection        $connection_upgrade;
      proxy_set_header    Upgrade           $http_upgrade;
  }

  location / {
      proxy_pass          http://localhost:3000/;
      proxy_set_header    Host              $host;
      proxy_set_header    X-Real-IP         $remote_addr;
      proxy_set_header    X-Forwarded-for   $proxy_add_x_forwarded_for;
      proxy_set_header    X-Forwarded-Proto "https";
  }
NOTE: Available in Grafana v6.3 and higher.
Create a metric query
You can use LogQL to wrap a log query with functions that create metrics from your logs.
For more information about metric queries, refer to the Loki metric queries documentation.
Apply annotations
Annotations overlay rich event information on top of graphs. You can add annotation queries in the Dashboard menu’s Annotations view.
You can use any non-metric Loki query as a source for annotations. Grafana automatically uses log content as annotation text and your log stream labels as tags. You don’t need to create any additional mapping.


