Observability
O## Observability
Observability, simply put, is the ability to understand the internal states of a system in real time by analyzing its outputs through externally accessible information.
Originating from Control Theory, the concept has become essential with the evolution of system architectures—particularly with the widespread adoption of distributed systems, containers, and microservices.
Through observability, engineers and developers gain a comprehensive view of system behavior, enabling:
-
- Problem identification
-
- Failure diagnosis
-
- Performance optimization
To achieve this, observability relies on three primary types of data:
- Metrics: Numeric measurements collected over time, offering a structured overview of system performance.
- Logs: Event records that provide contextual information about system activities.
- Traces: Represent the journey of a request across different components in a distributed system.
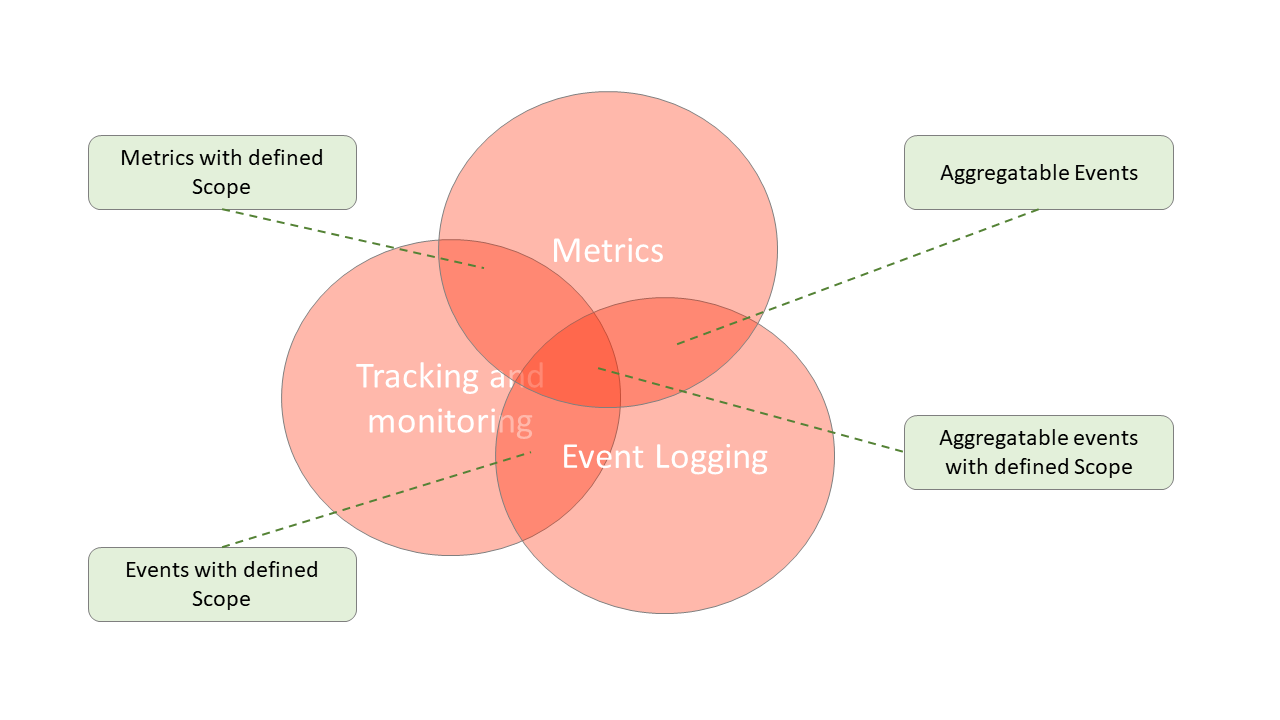
Monitoring vs Observability
Monitoring and observability, though related, are distinct concepts. Monitoring pertains to the collection, analysis, and alerting of system performance data, while observability, in a broader and more strategic sense, uses this data to understand the internal state of the system and its complex interactions. Observability, unlike monitoring, allows for the identification of emerging problems through analysis of patterns in system behavior over time.
Pillars of Observability
- Data Collection: Capturing relevant information, such as event logs, performance metrics, and request tracing.
- Storage and Processing: The collected data are stored in an accessible location for later analysis and can be processed to generate useful metrics and indicators.
- Visualization: The data presentation is clear and intuitive, making it easy for professionals to interpret.
- Proactive Monitoring: Enables the detection and resolution of problems before they become critical, reducing impacts on operations for users.
- Tracing and Diagnosis: Ability to trace the flow of a request or operation, enabling the identification of bottlenecks and performance issues.
- Data Correlation: Allows for the observation of seemingly disconnected events and the understanding of how parts of a system interact.
Exploring Observability
Observability is very important in modern technology environments, as it ensures that systems are functioning properly:
- Infrastructure: Widely used to monitor the health and performance of servers, networks, infrastructure resources, collecting metrics such as memory, disk space, network traffic, among others.
- Distributed Systems: Observability is crucial for diagnosing and resolving issues in distributed systems, enabling an understanding of how different components interact and impact the overall system performance.
- Containers and Microservices: Allows a holistic approach to observation, through logging practices, specific metric collection, and the use of distributed tracing.
- Databases: Helps in the early detection of bottlenecks and inefficiencies, enabling performance optimizations and improvements in data access by applications.
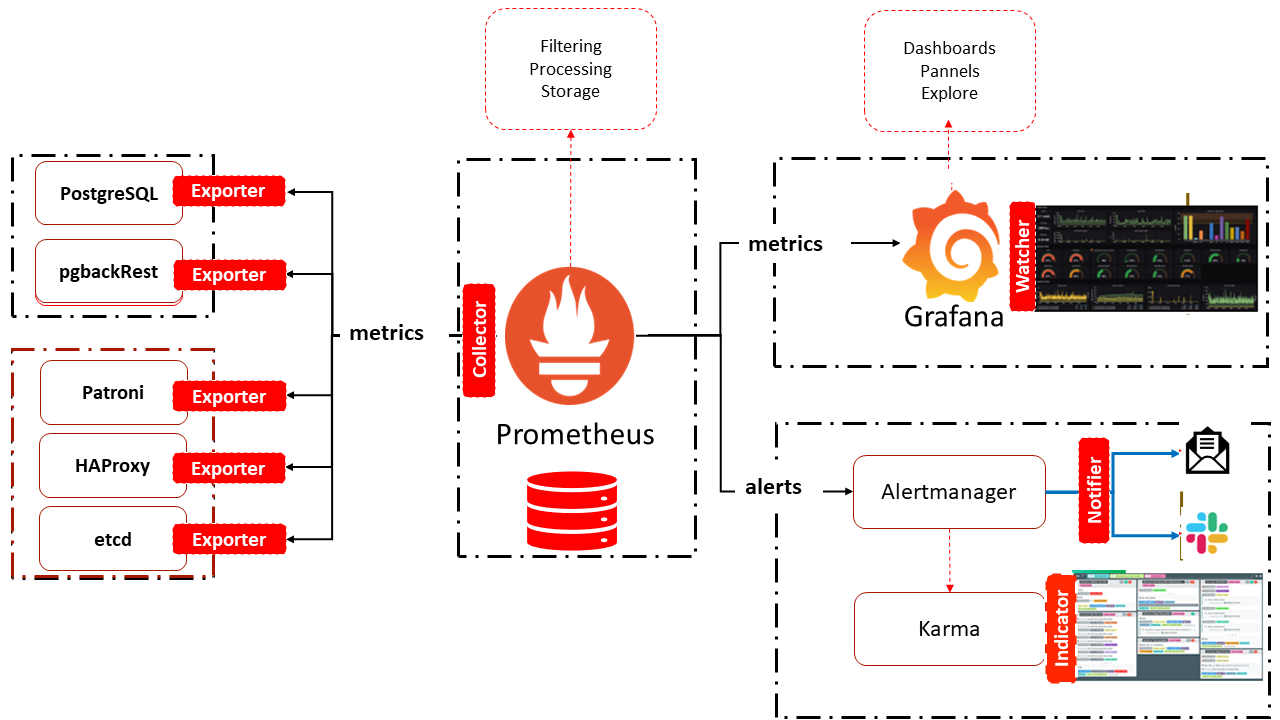
PostgreSYS Observability
The observability service implemented in PostgreSYS is designed to provide logs, metrics, and traces of all platform components, enabling a comprehensive and detailed view of the PostgreSQL database environment.
PostgreSYS provides fully integrated components, Prometheus and Grafana, which are widely used open-source solutions. The integration of these components represents an effective partnership in system observability. While Prometheus focuses on the collection and storage of metrics, Grafana offers the graphical representation of this data, facilitating the identification of trends, patterns, and anomalies.
Additionally, Alertmanager and Karma complement the platform's observability service, allowing for the management and visualization of alerts.
Prometheus
An open-source initiative originally developed by SoundCloud and later donated to the Cloud Native Computing Foundation(CNCF), Prometheus is a powerful monitoring and observability tool - a complete monitoring and trending system that includes built-in and active scraping, storage, query, graphing, and alerting based on time-series data.
Prometheus arose from the need for a monitoring system more flexible and adaptable than traditional solutions and was designed with fundamental principles of simplicity and reliability.
It offers several benefits for developers, engineers, and system administrators:
-
Dimensional Data Model: Prometheus uses a dimensional data model that allows users to define metrics with multiple dimensions. This facilitates data segmentation and analysis, enabling more granular and customized system observability;
-
Flexible and Efficient Collection: Prometheus is highly flexible in metric collection, supporting various collection protocols such as HTTP, DNS, SNMP, and others. Additionally, it uses a "pull" collection model, where monitoring servers retrieve metrics from different targets, making the collection efficient and scalable;
-
Robust Time Series Storage: Prometheus's time series storage architecture is optimized to handle large volumes of metric data. This enables long-term data retention and efficient querying, allowing for historical analysis and trend identification over time;
-
Integrated Alerts and Notifications: Prometheus has a flexible alert rule mechanism that allows users to define conditions for triggering alerts based on specific metrics. It also offers integration with notification tools such as Alertmanager to send alerts via email, Slack, PagerDuty, and more, facilitating problem detection and response;
-
Ecosystem and Integrations: Prometheus is part of a rich ecosystem of tools and integrations that extend its observability capabilities. For instance, it can be easily integrated with visualization tools like Grafana to create customized monitoring dashboards. Additionally, there are exporters available to collect metrics from a wide variety of systems and services, increasing Prometheus's monitoring coverage.
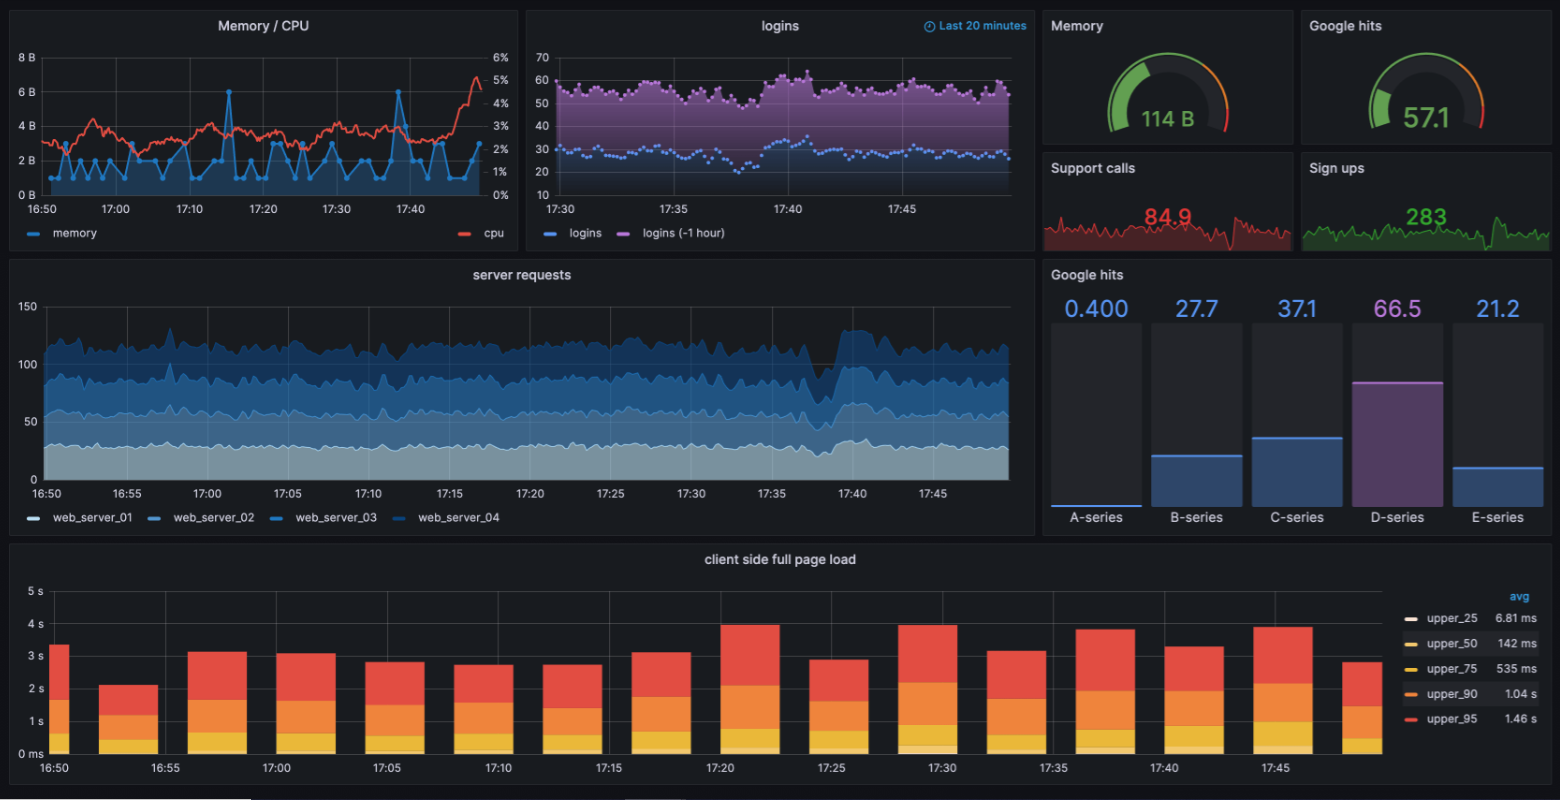
Grafana
Grafana is a highly versatile, open-source data visualization component, designed to query various data sources and enable the visualization and manipulation of information. It allows the creation of personalized and interactive dashboards.
Grafana emerged in 2014, developed by Swedish Torkel Ôdegaard. Initially focused on integration with Graphite, it evolved and expanded its functionalities and integrations, becoming an essential tool for monitoring and observability in a wide range of scenarios.
Due to its ability to connect with a variety of data sources, including databases, monitoring systems, cloud services, and much more, Grafana has become a popular choice.
Among its advantages are:
- Rich and customizable data visualization with an intuitive and flexible interface: Based on configurable panels, it presents various types of charts1, customizable dashboards, and specialized visualizations2.
- Support for multiple data sources: Integrates with various sources, such as Prometheus, facilitating data aggregation 3.
- Integrated alerts: Allows the setting of alerts directly on the panels.
- Accessibility and sharing of Dashboards: Facilitates the sharing of dashboards, promoting transparency and collaboration.
- Flexibility and extensibility: Supports plugins for new data types and custom panels.
- SQL and NoSQL queries directly on its panels: leveraging the full power of SQL to retrieve, filter, and process data and, for NoSQL databases, the use of specific languages for retrieval and manipulation. Additionally, it supports variables and dynamic panels with features for interaction and adjustment of queries and filters in real time.
Grafana not only shows metrics but also traces and logs, offering a holistic and detailed view of the system. Its dynamic panels foster an open data culture, enabling the sharing and discussion of information.
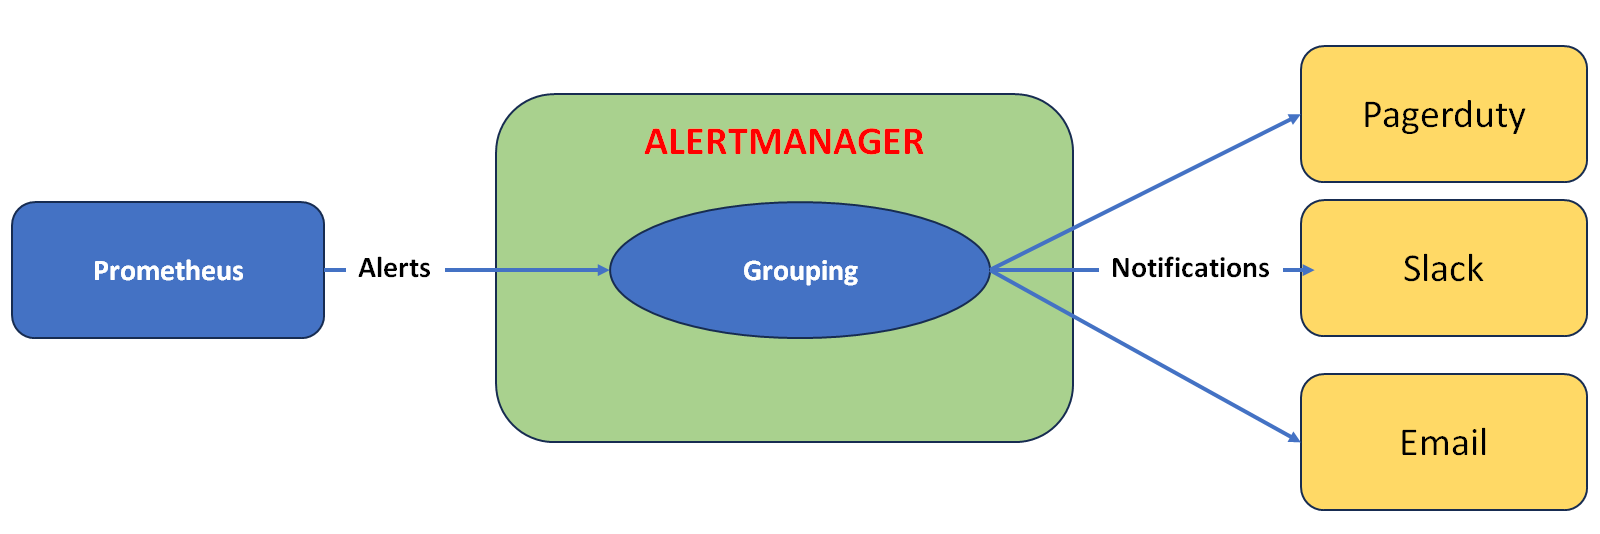
AlertManager
The AlertManager is a specialized tool integrated into the Prometheus ecosystem, responsible for managing Alerts.
When Prometheus detects a situation that meets a predefined alert criterion, it sends these alerts to the Alertmanager, which then decides what to do with them.
The main advantages of AlertManager include:
- Grouping: Groups similar alerts, reducing noise and facilitating the management and resolution of incidents;
- Inhibition: Related alerts can be suppressed based on defined criteria, avoiding an avalanche of notifications.
- Silencing: Allows specific alerts to be silenced (for example, when a problem is already known and being addressed).
- Routing: Depending on the severity of the alert or its type, it can be routed to different teams or channels such as email, Slack, or PagerDuty.
The AlertManager assists in focusing on important alerts, reducing noise and providing effective alert management tools, thus aiding in the efficient resolution of incidents, improving system reliability and availability.
-
The Alertmanager architecture includes:
- Server: The central component, responsible for receiving, processing, and forwarding alerts as per configured rules.
- Notification Integrators: Responsible for sending notifications to defined communication channels (email, SMS, Slack, etc.).
- Routing Rules: Define how alerts should be routed and notified based on specific criteria such as severity, type of alert, responsible team.
- Data Persistence: Can be configured to persist alerts in a database, allowing for historical queries and trend analysis.
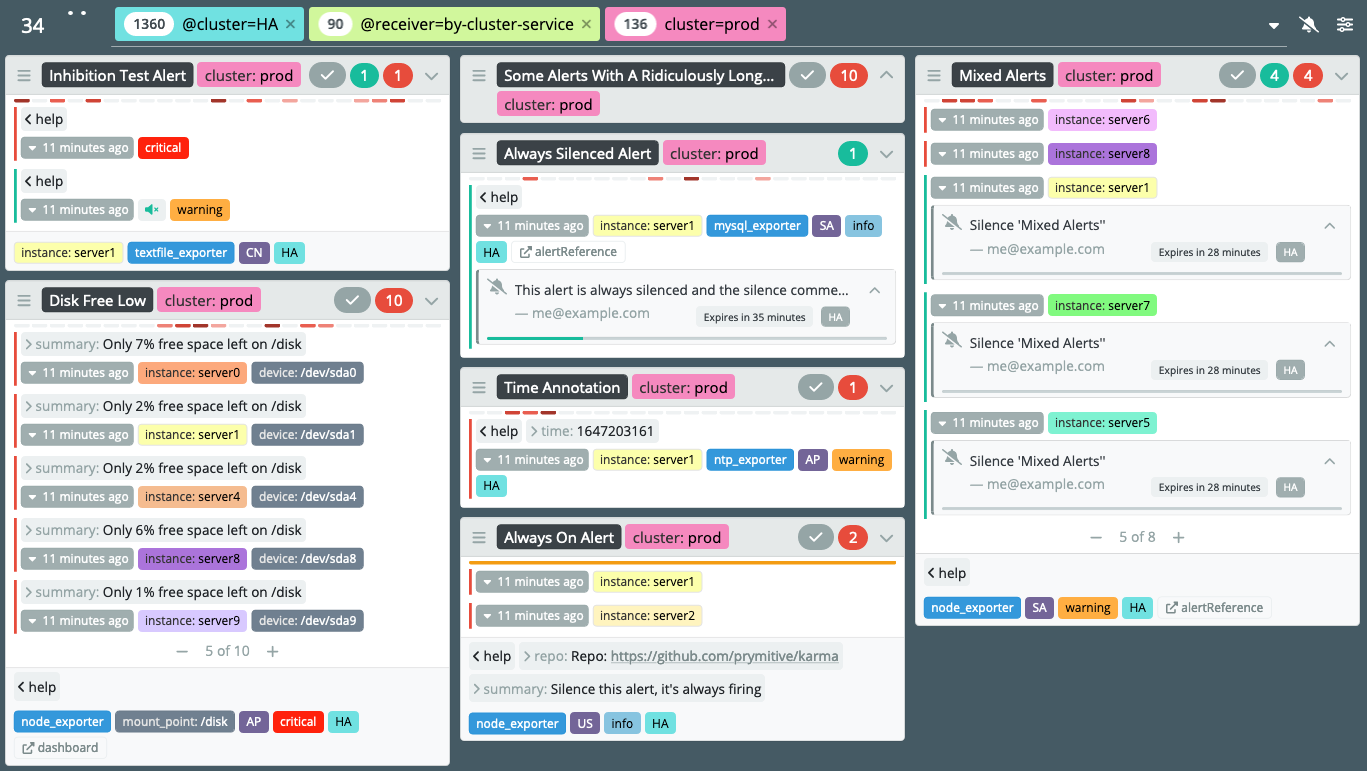
Karma
Karma is a Graphical User Interface (GUI) for the Alertmanager, which displays Prometheus alerts on a dashboard, allowing them to be easily managed. In a simplified way, Karma fills a gap in the Alertmanager, providing a dashboard tool for navigating through alerts and managing silences.
Karma fills a gap in Alertmanager by simplifying alert management through a navigation dashboard.
Karma displays grouped alerts, preserving the "group by" configuration option in the Alertmanager. It allows filtering on tags and adding or removing 'silences' on alerts.
Footnotes
-
Line charts, Bar charts, Pie charts, Gauges, Heat maps, Scatter plots, Histograms, Speedometer charts, Funnel charts, Sankey diagrams, Tree diagrams, Radar charts, etc. ↩
-
Heatmaps - used to show data in the form of heat areas, Sankey diagrams - used to show data flows, Bullet Charts - used to show data in a list format, Treemaps - used to show data in a tree format, Word Clouds - used to show data in the form of word clouds. ↩
-
Relational Databases, NoSQL, ETL Tools, APIs, REST and HTTP, Logs and Telemetry. ↩