PgBouncer Metrics Exporter Configuration
The PgBouncer Metrics Exporter exposes metrics such as the number of active connections, connections waiting in the queue, resource usage by PgBouncer, among others. This information is important to adjust the pooling operation and ensure that the environment is responding efficiently to client requests.
Through this configuration option, it is possible to specify the exposure port for PgBouncer metrics to be collected by Prometheus.
-
Observability components installed.
pgsmart obs exporter config [FLAGS]
Flags
-a, --agent=<agent>=> Alias, hostname, or IP of the server where the desired PgSmart Agent is installed.-h, --help=> Help
Non-interactive execution is disabled for this operation.
pgsmart obs exporter config
PgBouncer Exporter Configuration
- Instructions
- Video
-
Select the PgSmart Agent or register a new one.
-
Select the PgBouncer Metrics Exporter.
-
Add the Connection Pool Management instance(s).
warningThis metrics exporter requires the pre-configuration of the
_ignore_startup_parameters_parameter with the value_extra_float_digits_for each PgBouncer instance.This configuration can be done by PgSmart itself through the Connection Pool service configuration option.
This configuration is necessary for the connection driver to ignore certain parameters when initializing the connection.
It is important to note that the PgBouncer metrics exporter will be configured by PgSmart regardless of this configuration. However, the metrics export will only start after the
_ignore_startup_parameters_parameter is configured.3.1. Provide the connection port for Connection Pool Management.
3.2. Provide the user for Connection Pool Management.
3.3. Provide the password for the Connection Pool Management user.
3.4. Confirm if you want to add another Connection Pool Management instance.
3.5. Provide the metrics exposure port and web interface.
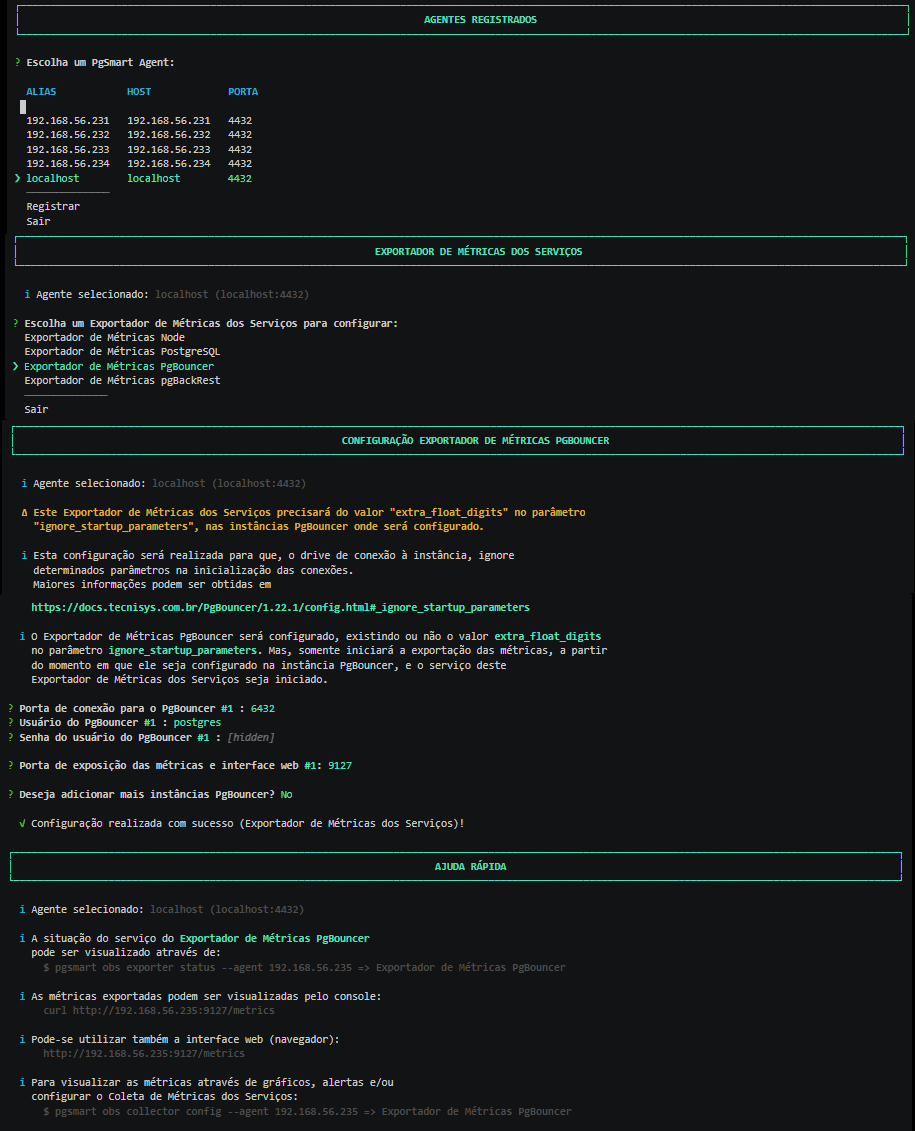 Figure 1 - PgBouncer Metrics Exporter Configurationnote
As many instances as necessary can be added.
noteThe exported metrics can be viewed via the console:
Terminal inputcurl http://192.168.56.234:9100/metricsOr via the web interface:
Terminal inputhttp://192.168.56.234:9100/metrics