Node Metrics Exporter Configuration
The Node Metrics Exporter is used to collect operational information from machines (physical or virtual). The Node Metrics Exporter provides metrics such as CPU, memory, disk, and network usage. It is widely used to monitor the health and performance of the environment.
Through this configuration option, it is possible to specify the exposure port for Node metrics to be collected by Prometheus.
Prerequisites
Command Syntax
Terminal input
pgsmart obs exporter config [Flags]
Flags:
-a, --agent=<agent>=> Alias, hostname or IP of the server where the desired PgSmart Agent is installed.-h, --help=> Help
Non-Interactive Configuration
Non-interactive execution is disabled for this operation.
Interactive Configuration
Terminal input
pgsmart obs exporter config
Node Metrics Exporter Configuration
- Instructions
- Video
-
Select the
PgSmart Agent(or Register new Agent). -
Select the Node Metrics Exporter.
-
Specify the exposure port for metrics and web interface.
-
Result of the Metrics Exporter Configuration:
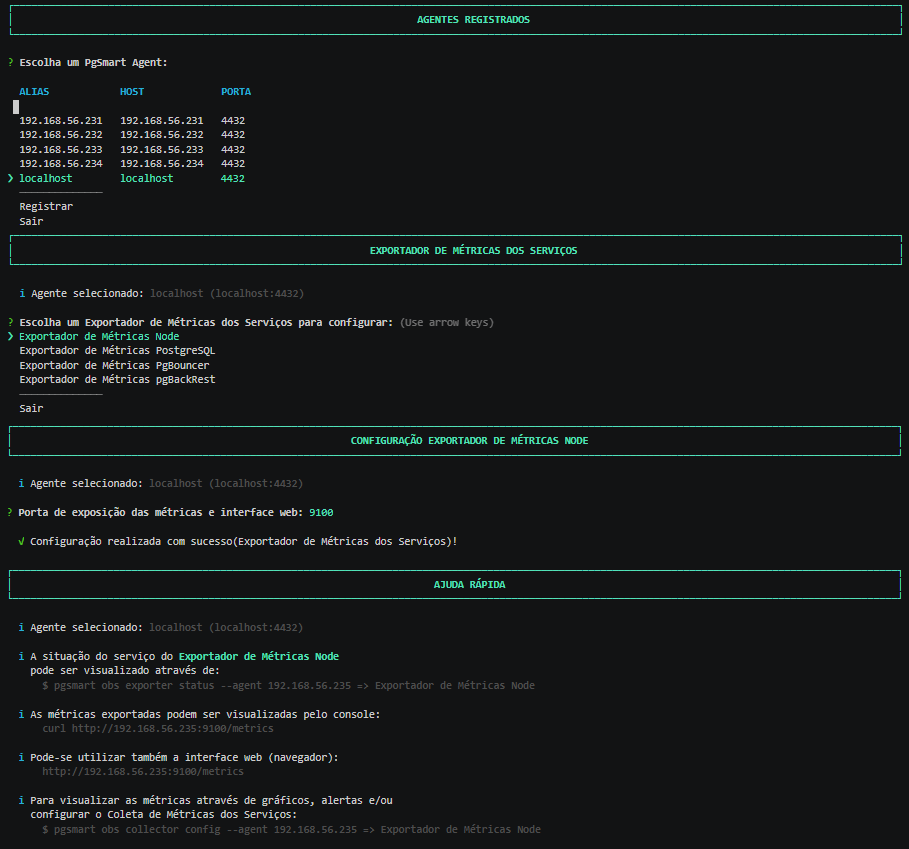 Figure 1 - Node Metrics Exporter Configurationnote
The exported metrics can be viewed via the console:
Terminal inputcurl http://192.168.56.235:9100/metricsOr via the web interface:
Terminal inputhttp://192.168.56.235:9100/metrics
Carregando...