PgBouncer Metrics Exporter Configuration via PgSmart Web
The PgBouncer Metrics Exporter exposes metrics such as the number of active connections, connections waiting in the queue, resource usage by PgBouncer, and more. This information is crucial to fine-tune the pooling operation and ensure the environment responds efficiently to client requests.
Through this configuration option, it will be possible to specify the exposure port for PgBouncer metrics to be collected by Prometheus.
-
Observability components installed.
- Instructions
- Video
-
Select the desired
Environmentfrom the dropdown in the top bar. -
Select the
Pool de Conexõesoption from the side menu. The installed Database Services will be displayed incardsformat. -
From the list of cards, select the pool component for which you want to configure the Metrics Exporter.
-
Select the
Métricastab. -
Adjust the exposure port for the metrics and web interface, if desired.
-
Adjust the PgBouncer user and respective password, if desired.
-
Click
Salvar.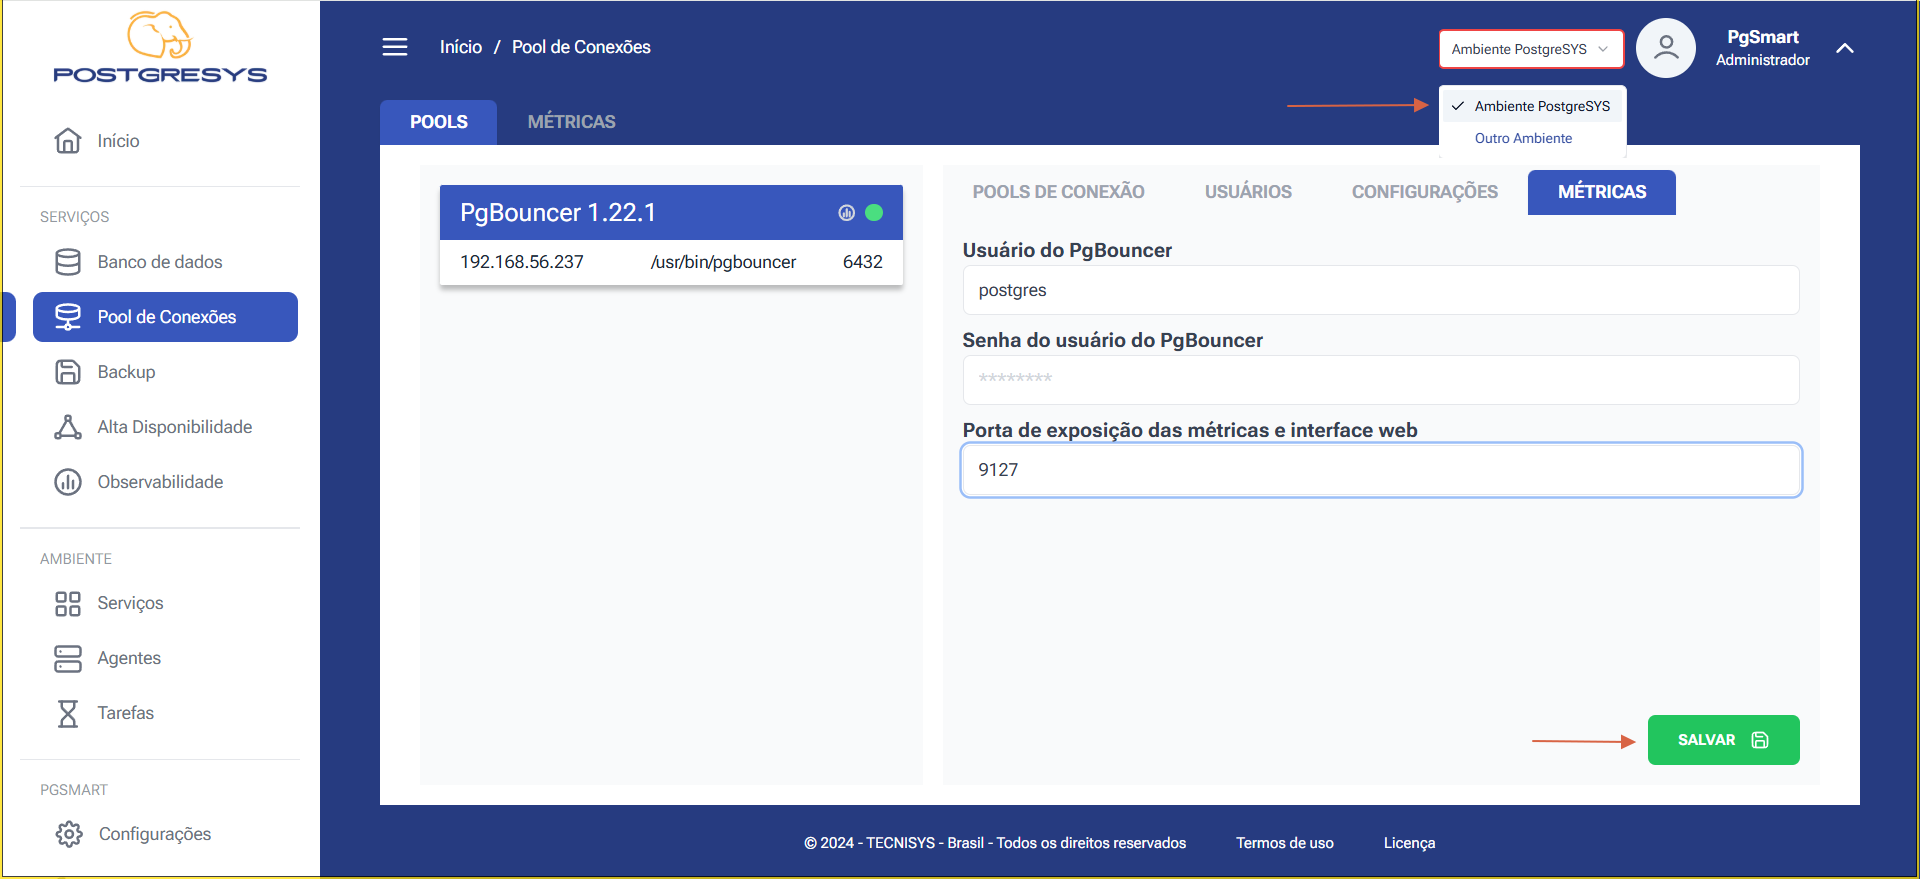 Figure 1 - PgBouncer Exporter Configuration - Edit Data