Metrics Collector (Prometheus) Management via PgSmart Web
Below are the available commands to manage the Metrics Collector service.
- Instructions
- Stop
- Initialize
- Restart
- Reload
-
Select the desired
Environmentfrom the dropdown in the top bar. -
Select the
Observabilidadeoption in the sidebar. -
Select the
Collectortab. -
In the
cardslist, select the desired service. -
Right-click on the selected service.
5.1. Select
Iniciarto start the Metrics Collection and Storage Service (Monitoring Service) - Prometheus.5.2. Select
Pararto stop the Metrics Collection and Storage Service (Monitoring Service) - Prometheus.5.3. Select
Reiniciarto restart the Metrics Collection and Storage Service (Monitoring Service) - Prometheus.5.4. Select
Recarregarto reload the Metrics Collection and Storage Service (Monitoring Service) - Prometheus.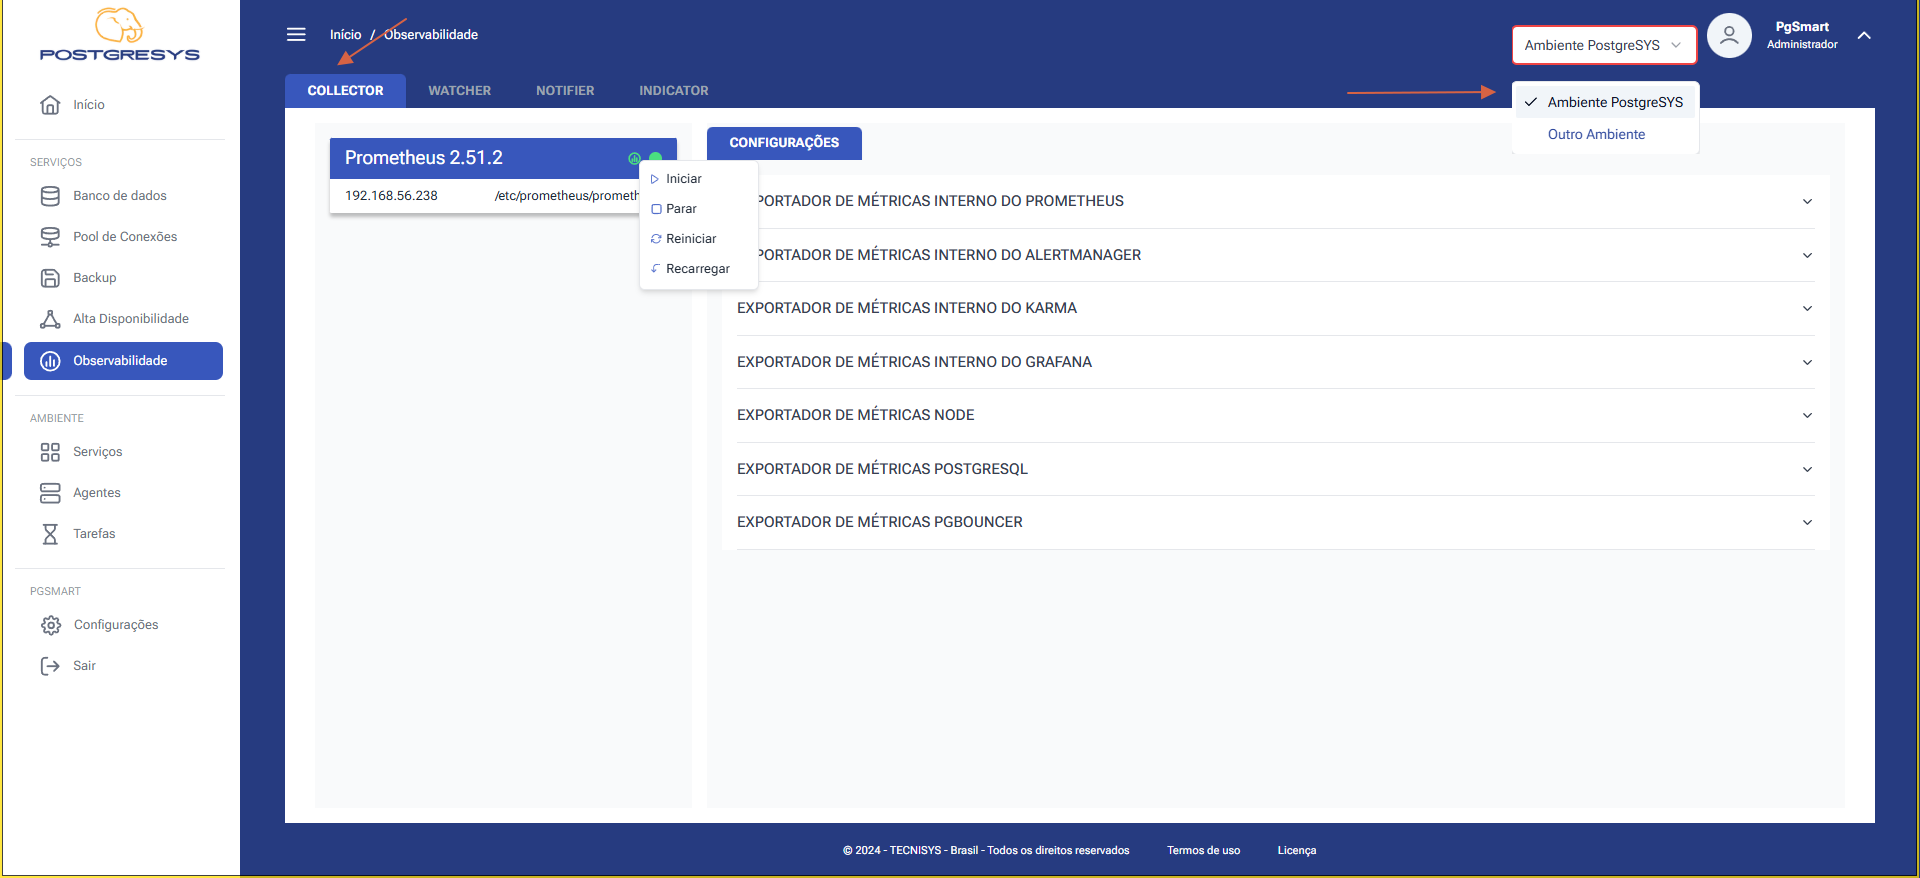 Figure 1 - Control of the Metrics Collection and Storage Service (Monitoring Service) - Prometheus