Observability Service Installation via PgSmart Web
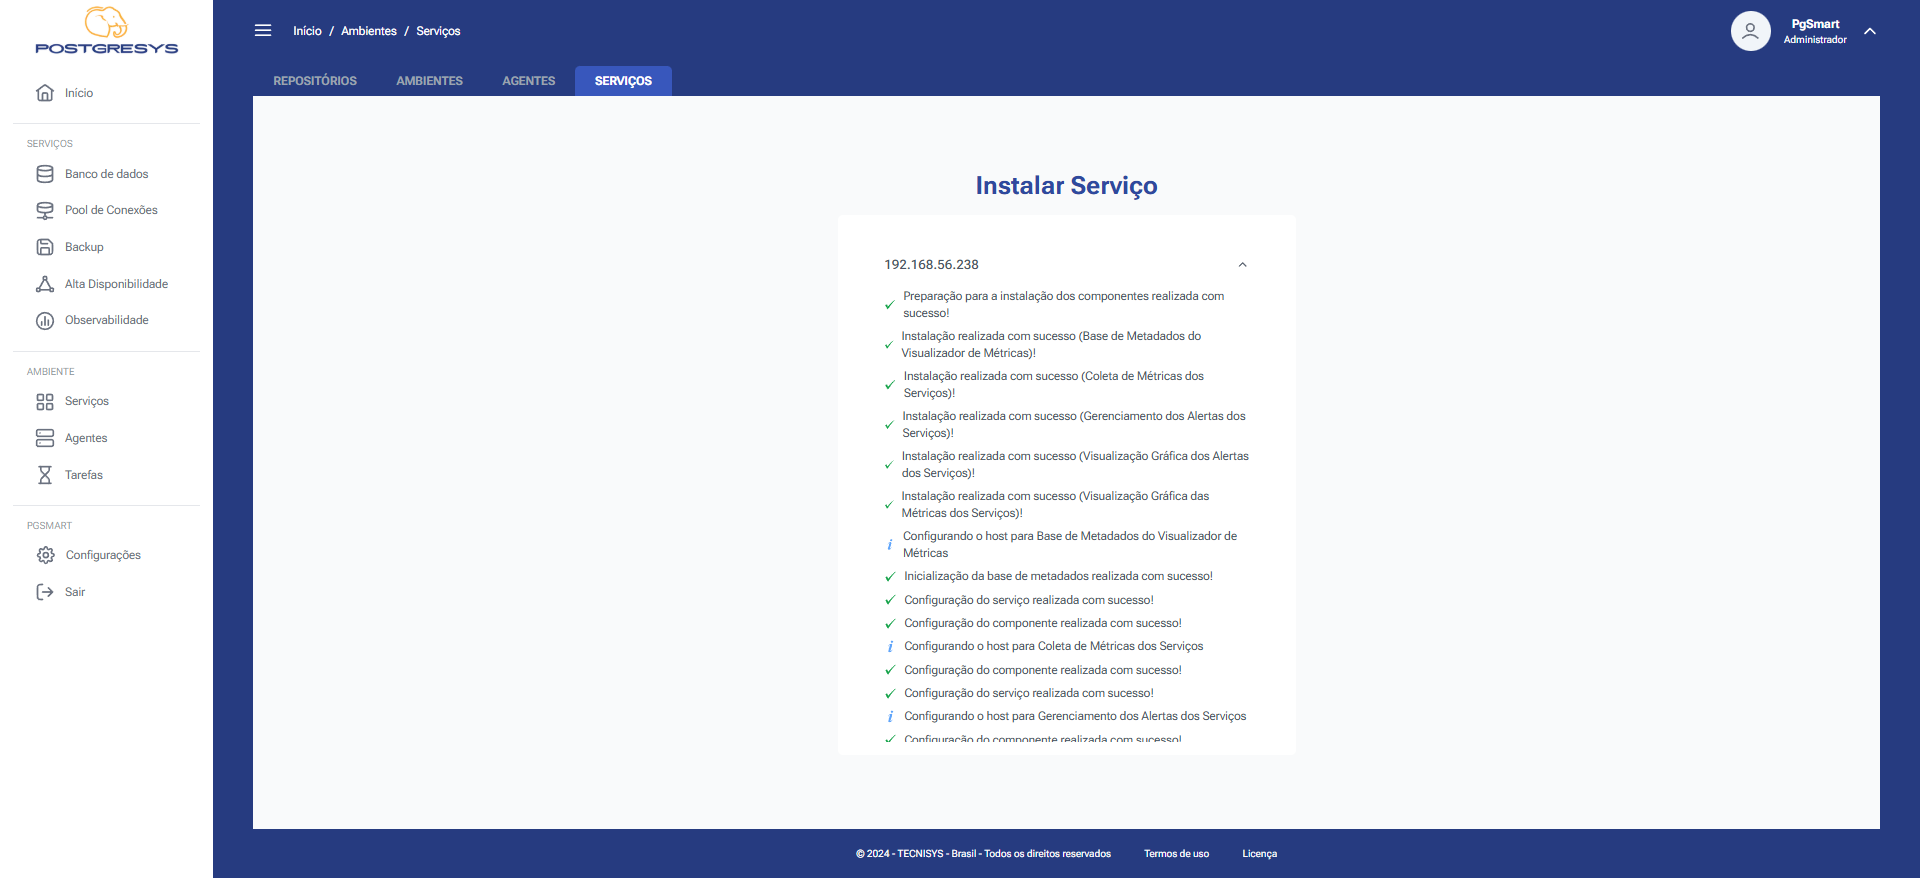
In PostgreSYS, the observability service is implemented through the integration of the following components, responsible for collecting, storing, and displaying metrics and alerts across the PostgreSQL database environment:
- Prometheus: responsible for collecting and storing metrics;
- Grafana: visualizes the collected metrics through dashboards;
- AlertManager: manages and sends alerts based on defined rules;
- Karma: provides a user-friendly interface for AlertManager alerts;
- Metrics Exporters: tools that expose metrics to Prometheus.
-
Exporters are installed automatically along with the PgSmart agents when needed.
-
In some services (like etcd, Patroni, HAProxy, Grafana, and Karma), there is no separate exporter because the component itself includes metrics exporting as part of its execution.
-
PgSmart Web Installation, meeting the minimum requirements.
-
Additional package repository to resolve indirect dependencies. In line with each organization's security and support policies, Tecnisys does not provide these packages. For Enterprise Linux distributions, the Extra Packages for Enterprise Linux - EPEL repository usually provides the necessary dependencies.
-
The PgSmart Agent must be installed and running on the machine where the service will be installed.
-
Agent Registration via the PgSmart Client.
- Instructions
- Video
- Go to
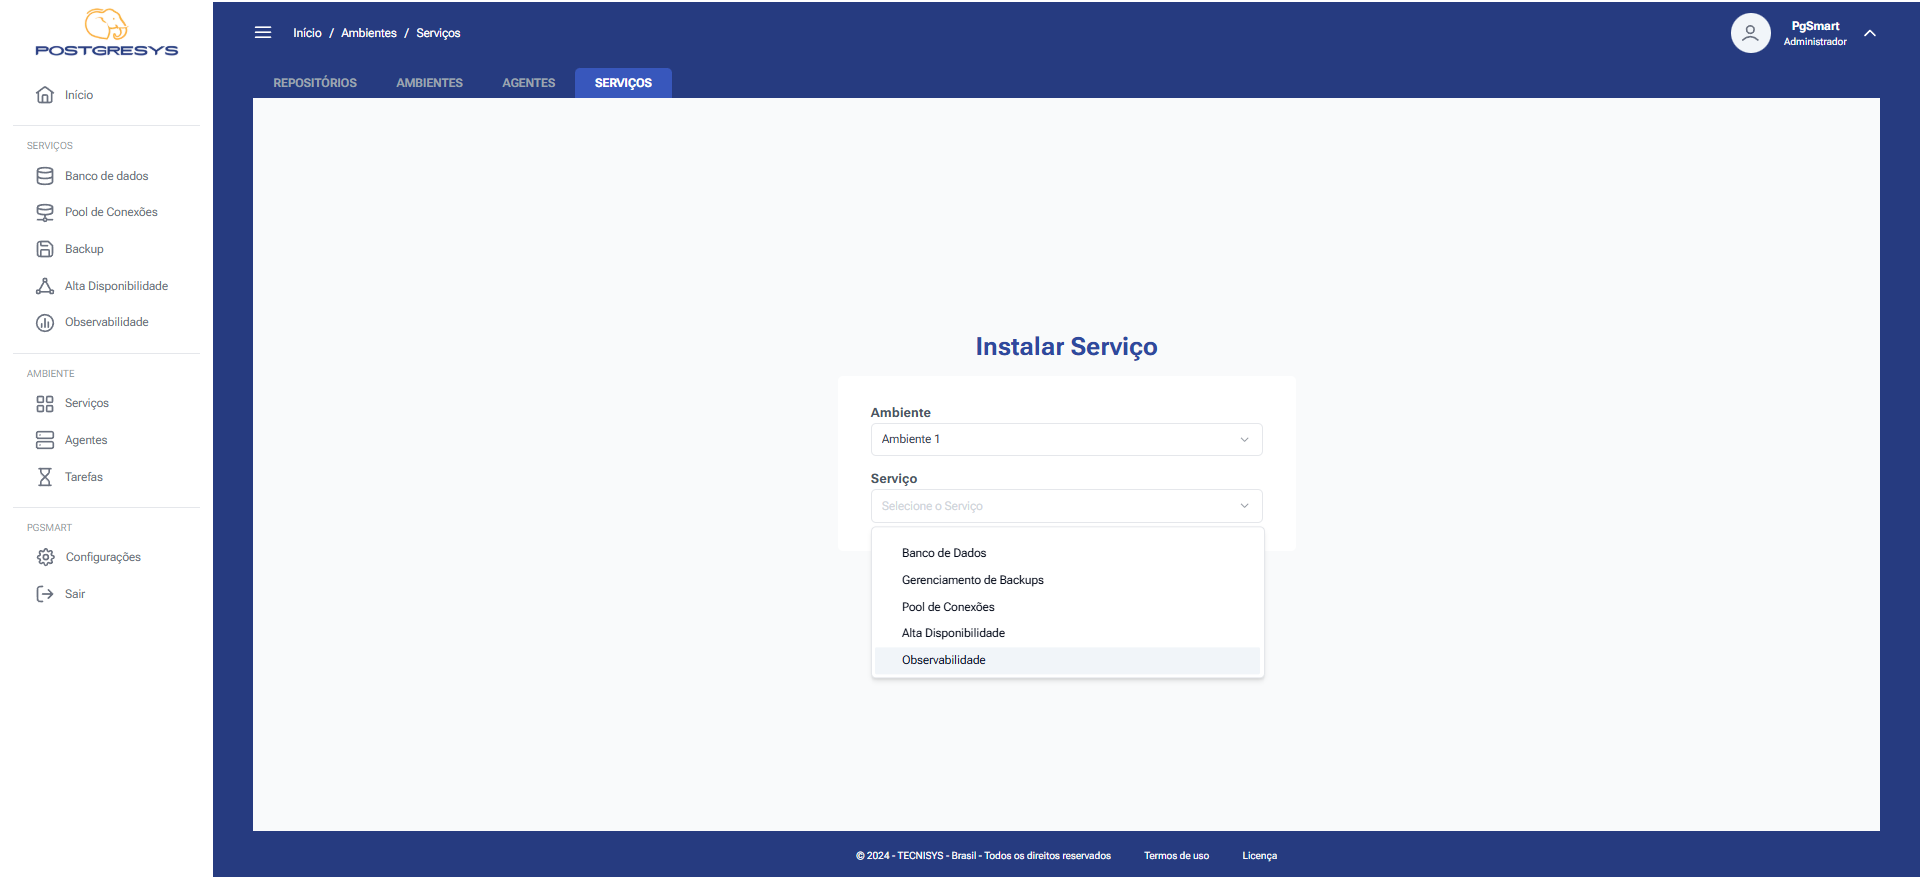
Início/Gerenciar Ambientes/Serviços. All installed services in all environments will be listed. - Click
Instalar. - Select the
Environmentwhere the service will be installed. - Select the
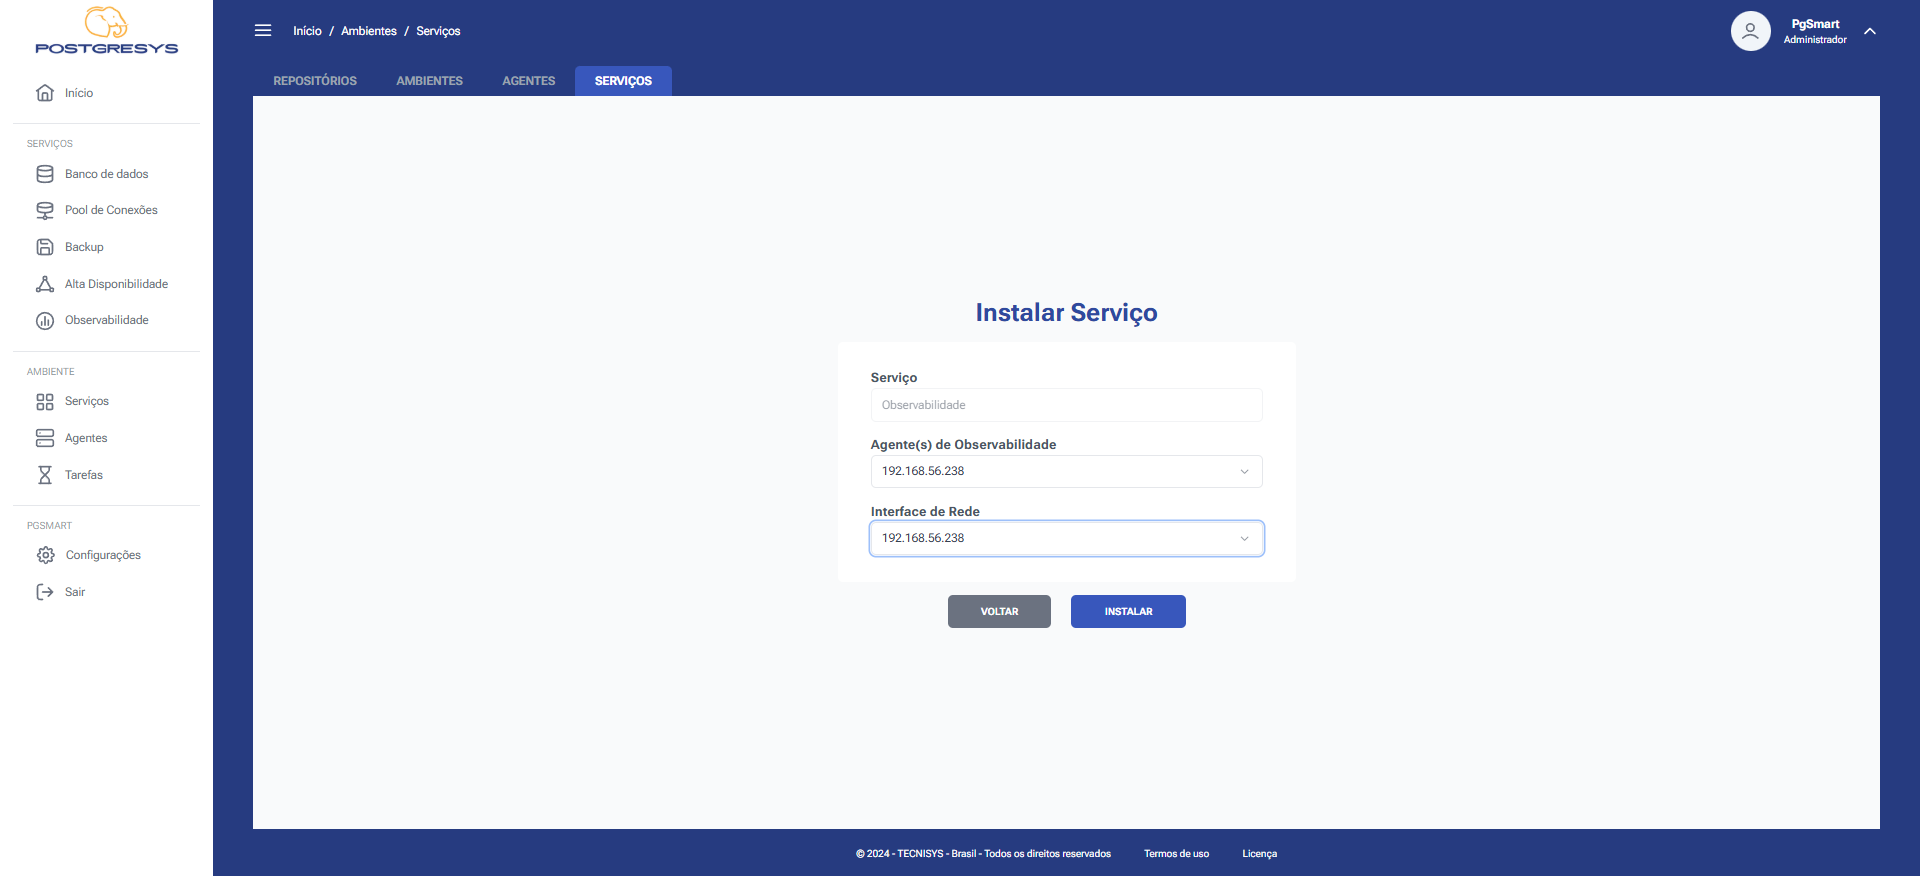
Observabilityservice. - Select the
Observability Agent(s). - Select the
Network Interface. - Click
Instalar.