PostgreSQL Metrics Exporter Configuration
The PostgreSQL Metrics Exporter collects information such as transactions, query latency, memory usage by processes, database usage statistics, among others. It helps administrators monitor the health and performance of their PostgreSQL instances, facilitating optimizations and adjustments.
This configuration allows defining the port used to expose PostgreSQL metrics for Prometheus collection.
To perform this operation, PgSmart automatically creates the "PgSmart" user on monitored PostgreSQL instances. If preferred, this operation can be performed manually. To do so, follow these steps:
-
Connect to the desired PostgreSQL instance.
-
Execute the following command to create the PgSmart user:
Terminal inputCREATE USER pgsmart ENCRYPTED PASSWORD 'QWEpgTecSmartnisysRTY'; -
Execute the following command to grant the pg_monitor role (read and execute monitoring views and functions privileges only) to the pgsmart user:
Terminal inputGRANT pg_monitor TO pgsmart;
The PostgreSQL Metrics Exporter can be configured regardless of the PgSmart user’s existence. However, metric exportation will only start once the user exists with proper privileges on the monitored instance.
-
Observability components installed.
pgsmart obs exporter config [Flags]
Flags:
-a, --agent=<agent>Alias, hostname or IP of the server where the desired PgSmart Agent is installed.-h, --helpHelp
Non-interactive execution is disabled for this operation.
pgsmart obs exporter config
PostgreSQL Metrics Exporter Configuration
Manual Creation of Access User
- Instructions
- User Creation
- Configuration
-
Select the
PgSmart Agentor Register a new one. -
Select the
Exportador de Métricas PostgreSQLoption. -
Select the instance's Data Directory (PGDATA) (or add the desired Data Directory).
-
Confirm whether you want PgSmart to create the access user:
4.1. Enter the PostgreSQL superuser name. 4.2. Enter the PostgreSQL superuser password.
noteThe provided credentials are not stored by PgSmart. They are used only for the creation of the access user and are handled only in memory.
-
Set the metrics exposure port and web interface.
-
Confirm whether you want to add more PostgreSQL instances.
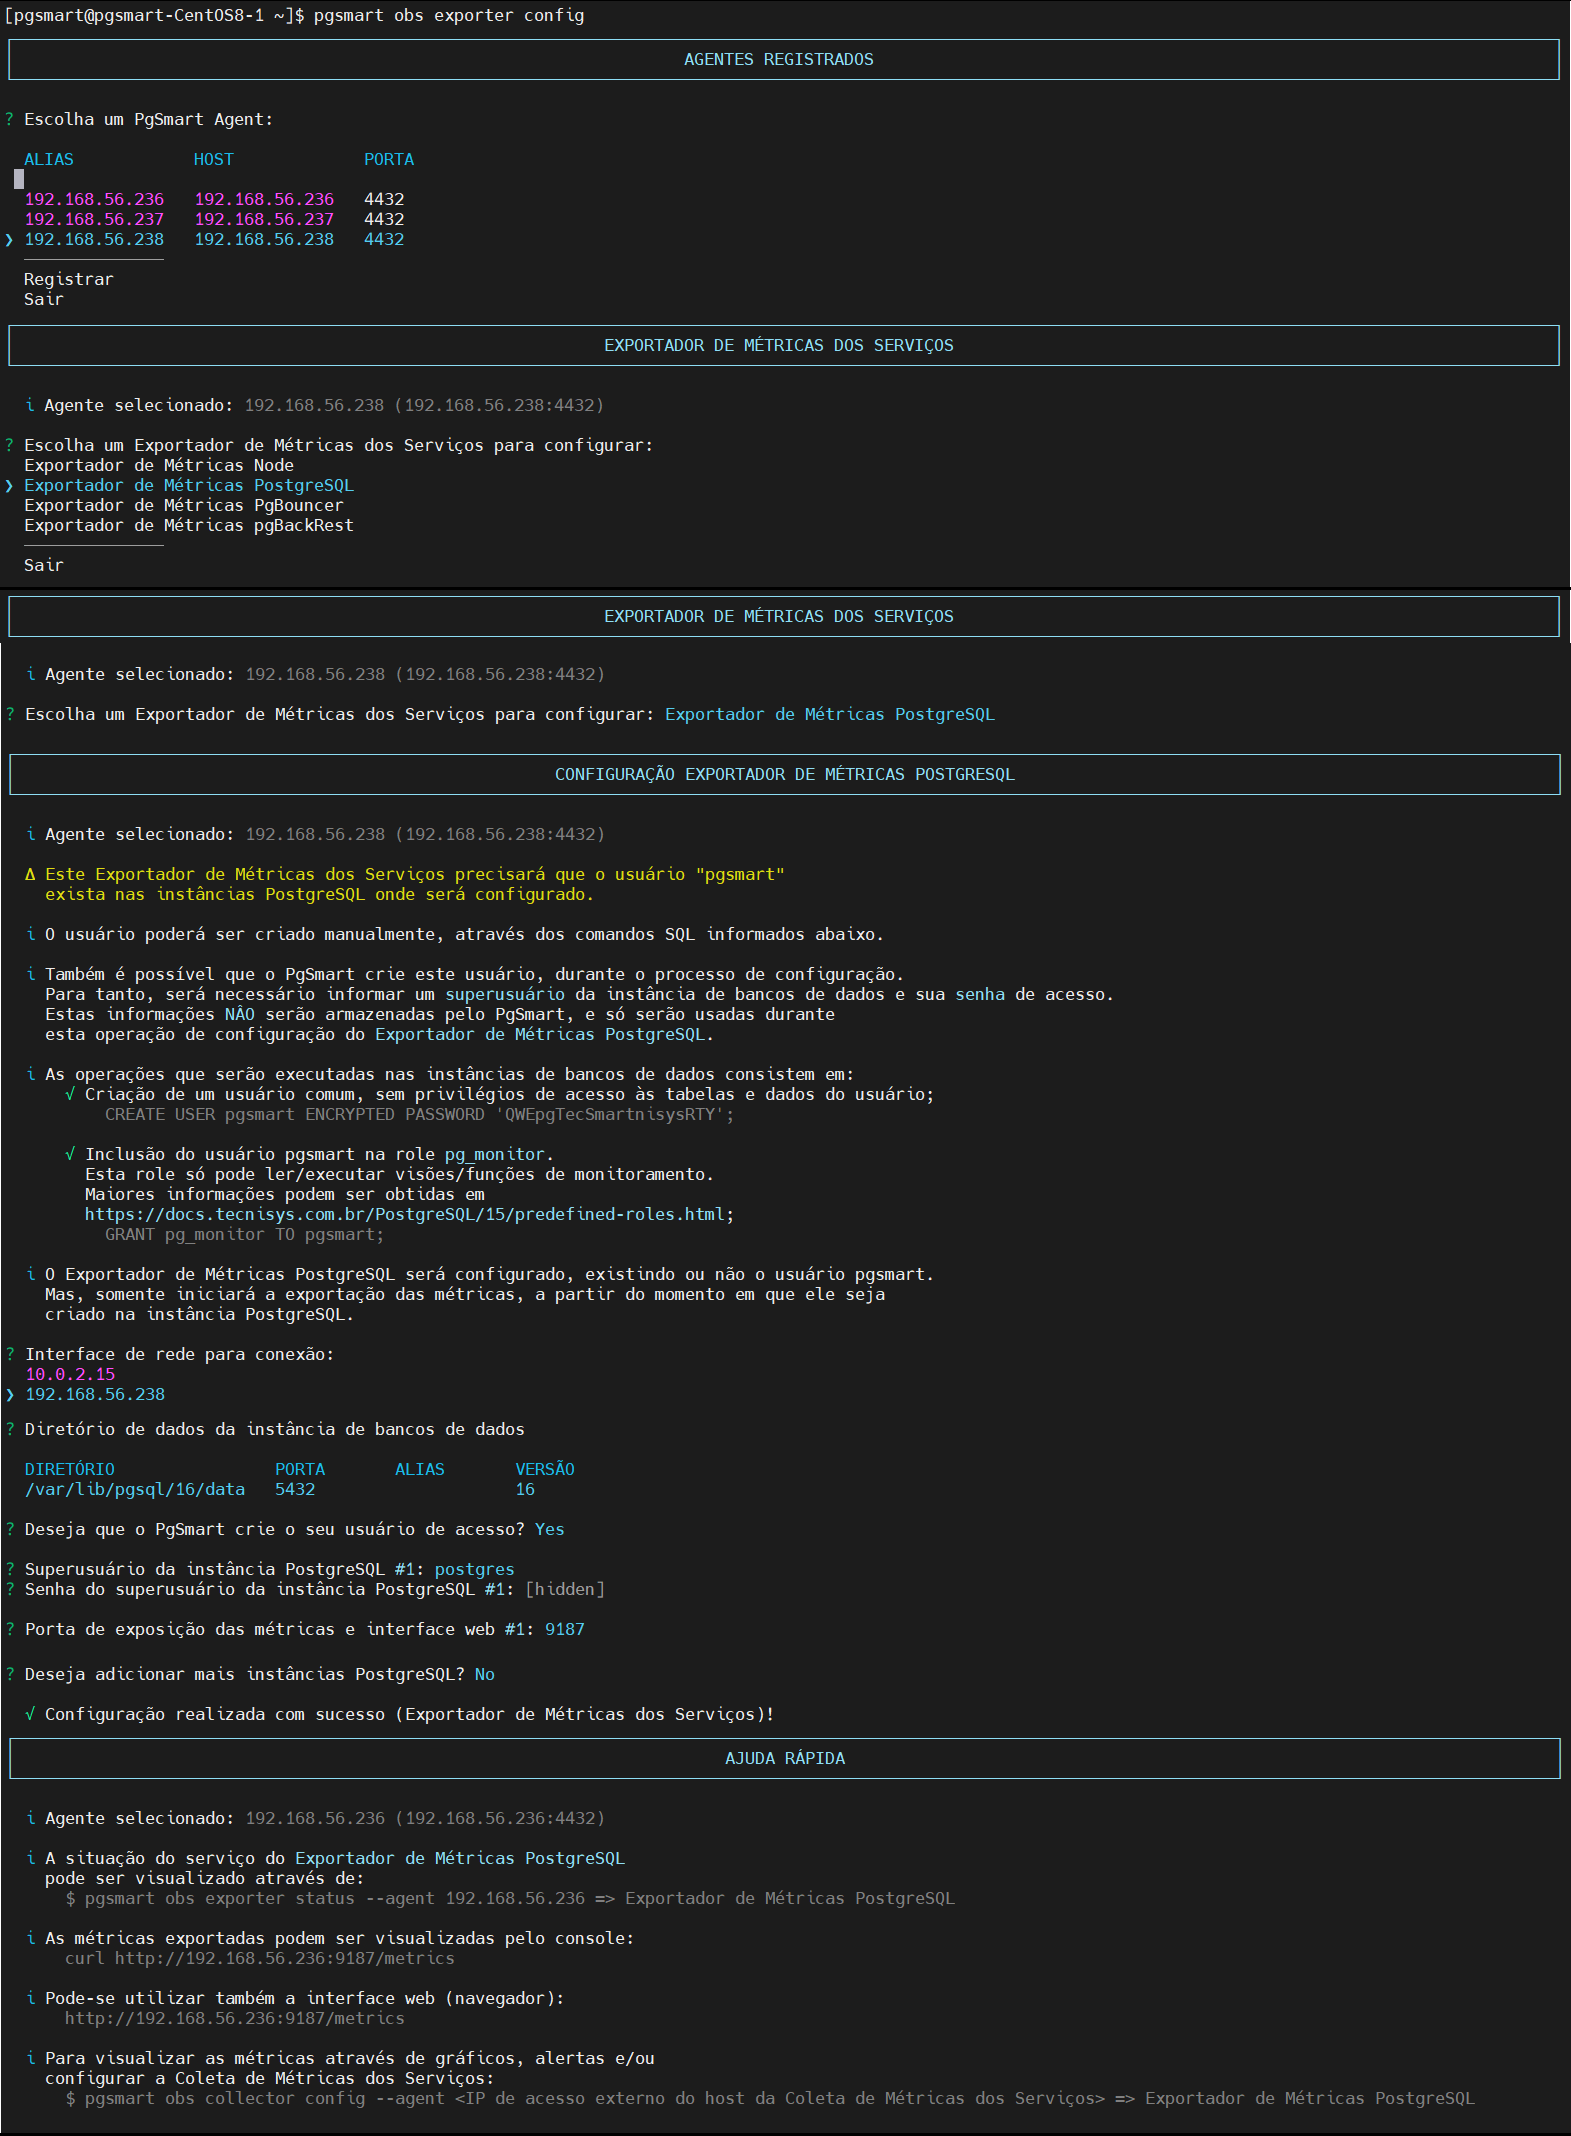 Figure 1 - PostgreSQL Metrics Exporter Configurationnote
Metrics can be viewed through the console:
Terminal inputcurl http://192.168.56.235:9100/metricsOr through the web interface: