Metrics Collector Configuration
In the context of Prometheus, the collector refers to the Prometheus server, which gathers data from multiple exporters.
This option allows you to configure how Prometheus should discover each Metrics Exporter. The available actions are: List, Add, and Remove the hosts configured for each Exporter's metric collection.
-
Observability components installed and configured.
pgsmart obs collector config [FLAGS]
Flags
-a, --agent=<agent>=> Alias, hostname or IP of the server where the desired PgSmart Agent is installed.-h, --help=> Help
Non-interactive execution is disabled for this operation.
pgsmart obs collector config
Metrics Collection Setup
-
Select the
PgSmart Agentor Register a new one. -
Select the type of Metrics Exporter to configure for collection (
Node|PostgreSQL|PgBouncer|pgBackRest|Patroni|etcd|HAProxy).
Once the Exporter is selected, the following operations are available:
- Listar — Allows viewing the list of hosts configured for the selected exporter
- Adicionar — Allows adding a host for metrics collection
- Remover — Allows removing a host from metrics collection
List Metrics Exporters
- Instructions
- Video
- Select the
Listaroperation.
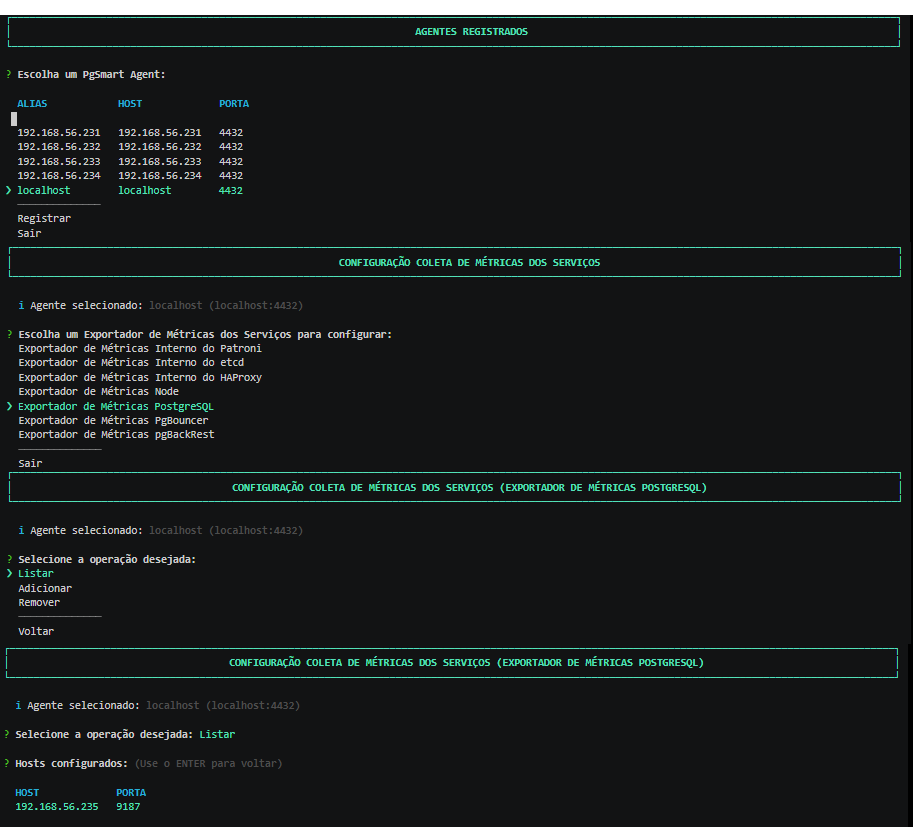
The list of Metrics Exporters currently recognized by the Collector will be shown.
Add a Metrics Exporter to the Collector
- Instructions
- Video
-
Select the
Adicionaroperation. -
Enter the connection IP of the selected Metrics Exporter.
-
Enter the metrics exposure port (used by the web interface)
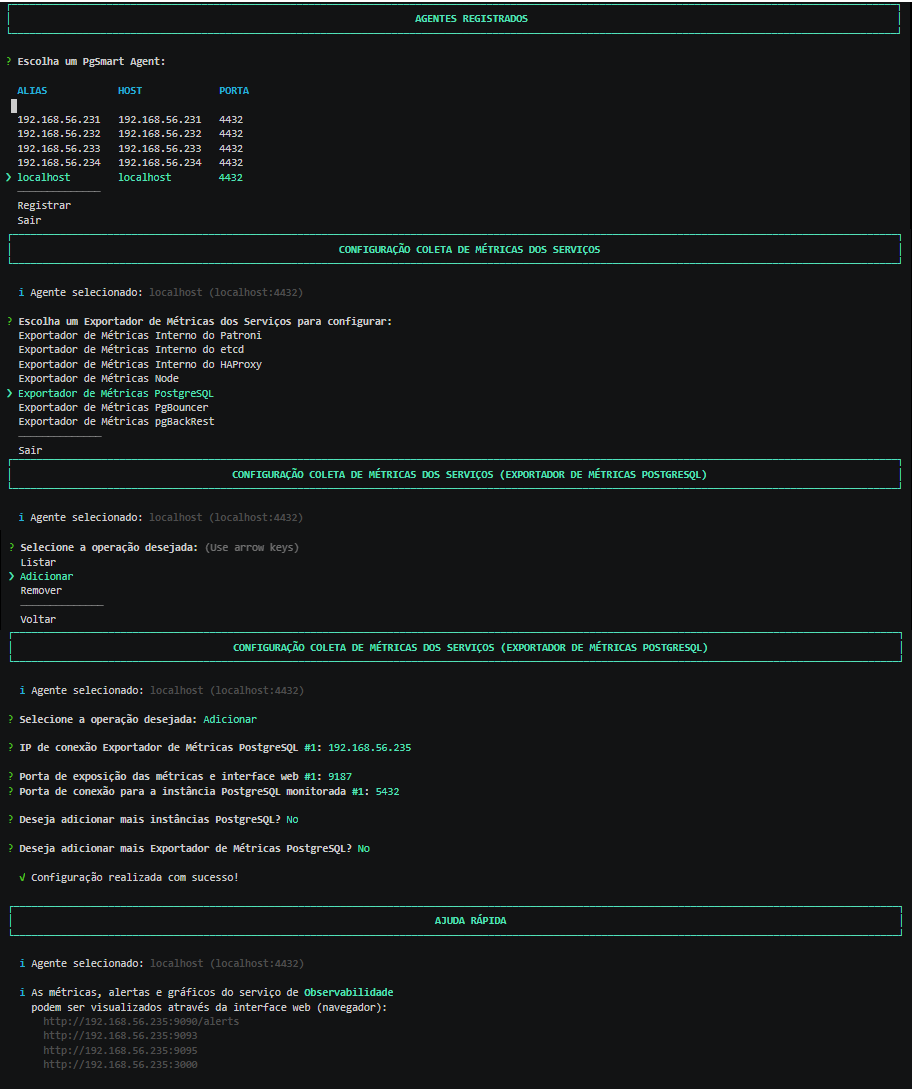 Figure 2 - Collector Configuration - Add
You can add multiple instances of the selected Metrics Exporter.
Remove a Metrics Exporter from the Collector
- Instructions
- Video
-
Select the
Removeroperation. -
Select the Metrics Exporter you want to remove from the Collector.
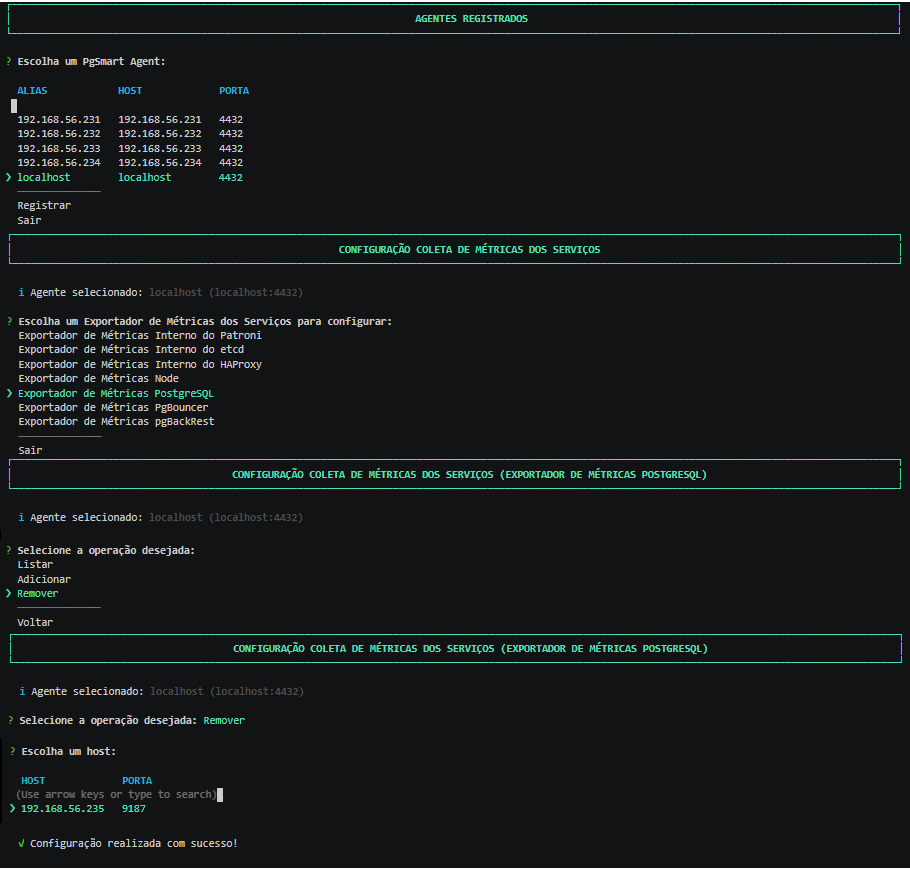 Figure 3 - Collector Configuration - Remove