Metrics Dashboard (Grafana) Management via PgSmart Web
After installing and configuring the observability components, the collected metrics will be available in Grafana dashboards, the Metrics Dashboard of the PostgreSYS platform.
Once the Metrics Dashboard (watcher) service is active, it can be accessed via the address http://<IP>:3000.
In the URL, replace <IP> with the IP or hostname of the machine where the observability service was installed. For the first access, use the default username and password: admin/admin.
Below are the available commands to manage the Metrics Dashboard service via PgSmart.
- Instructions
- Stop
- Initialize
- Restart
-
Select the desired
Environmentfrom the dropdown in the top bar. -
Select the
Observabilidadeoption in the sidebar. -
Select the
Watchertab. -
In the
cardslist, select the desired service. -
Right-click on the selected service.
5.1. Select
Iniciarto initialize the Metrics and Dashboard Service (Grafana).5.2. Select
Pararto stop the Metrics and Dashboard Service (Grafana).5.3. Select
Reiniciarto restart the Metrics and Dashboard Service (Grafana).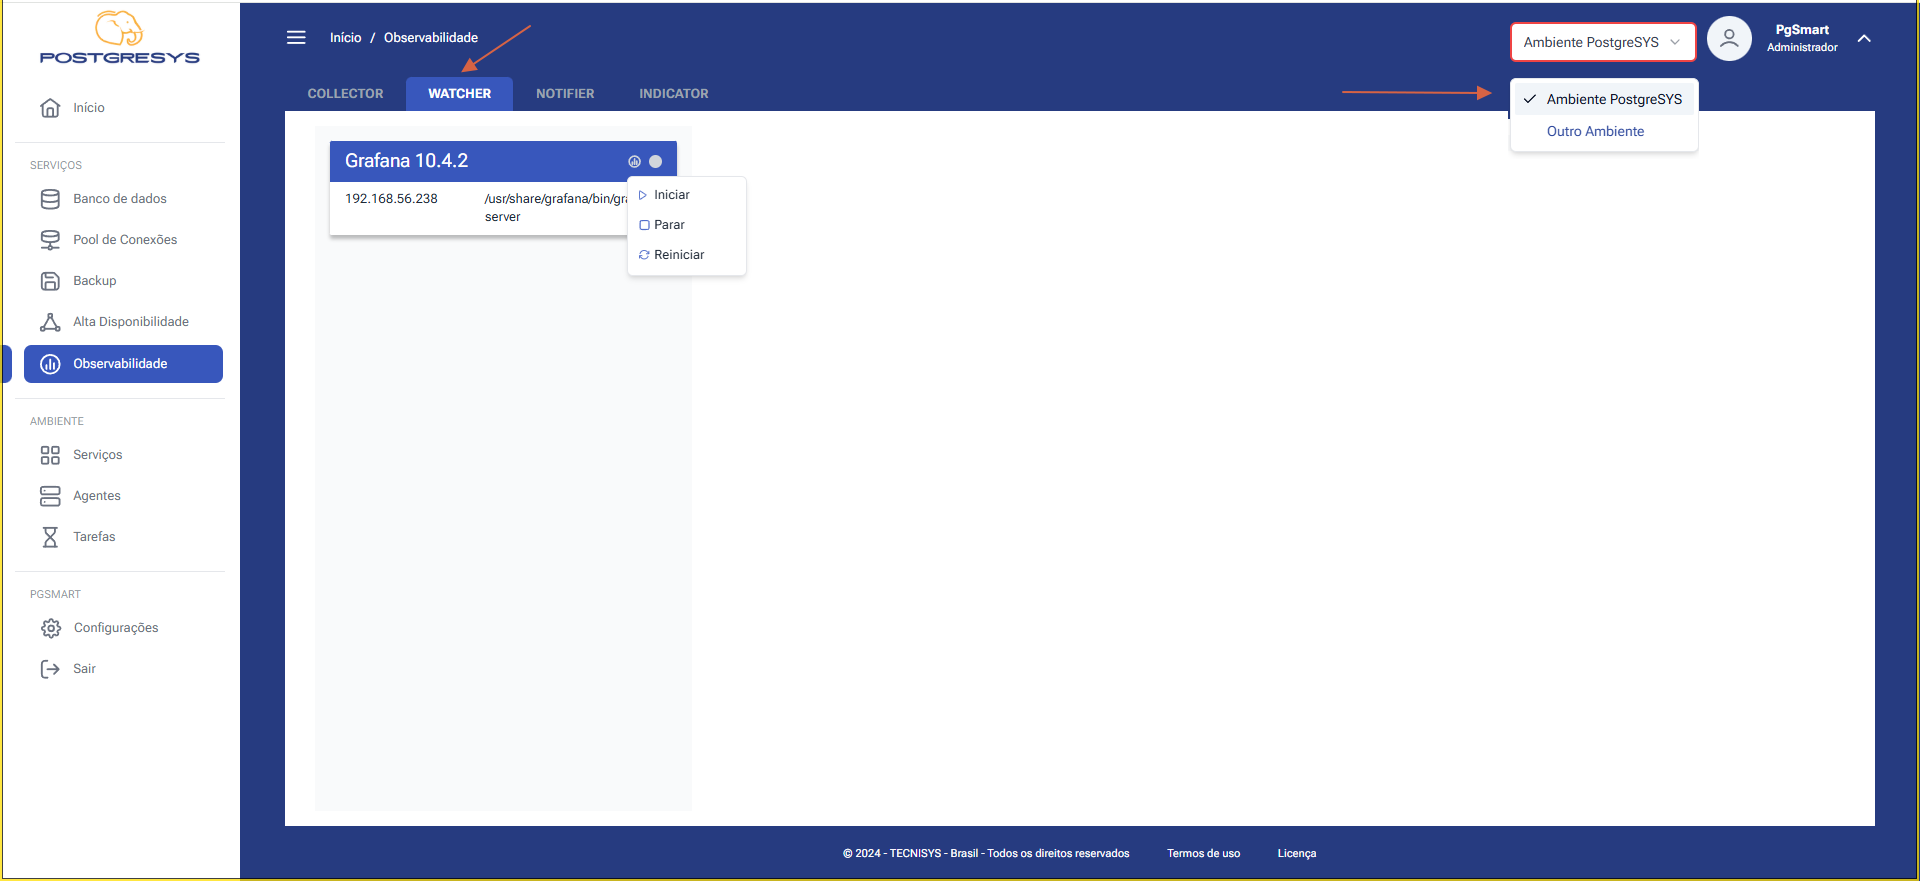 Figure 1 - Control of the Metrics and Dashboard Service (Grafana)