Metric Panel Management - Grafana
After installing and configuring the observability components, the collected metrics will be available on Grafana dashboards, which make up the Metric Panel of the PostgreSYS platform.
If the Metric Panel service (watcher) is running, it can be accessed via the URL http://<IP>:3000.
In the URL, replace <IP> with the IP address or hostname of the machine where the observability service is installed. For the first login, use the default credentials: admin/admin.
Below are the available commands to manage the Metric Panel service using PgSmart.
Command Syntax
Terminal input
pgsmart obs watcher [OPERATION] [FLAGS]
Operations:
- Status — Allows checking the status of the Metric Panel service
- Start — Allows starting the Metric Panel service
- Stop — Allows stopping the Metric Panel service
- Restart — Allows restarting the Metric Panel service
Flags:
-a, --agent=<agent>→ Alias, hostname or IP address where the PgSmart Agent is installed-h, --help→ Help-q, --quiet→ Non-interactive execution for Metadata Database control (status|start|stop|restart|reload)
Non-Interactive Execution
Terminal input
pgsmart obs watcher [status|start|stop|restart] -q -a <agent>
Interactive Execution
Metric Panel Service Status
- Instructions
- Video
Terminal input
pgsmart obs watcher status
-
Select the
PgSmart Agentor register a new one.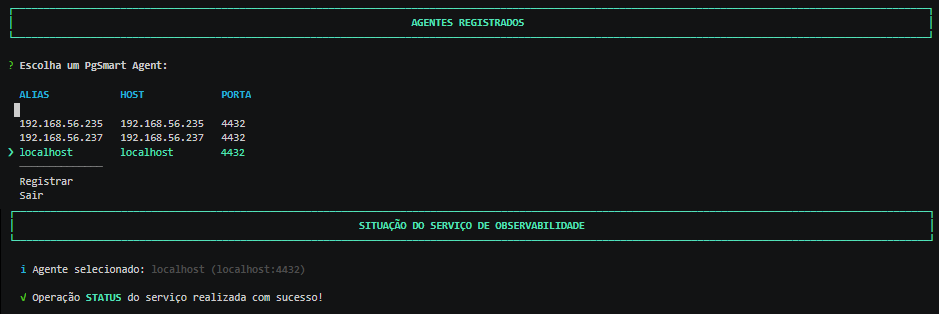 Figure 1 - Metric Exporter - watcher - Status
Carregando...
Stop Metric Panel Service
- Instructions
- Video
Terminal input
pgsmart obs watcher stop
-
Select the
PgSmart Agentor register a new one.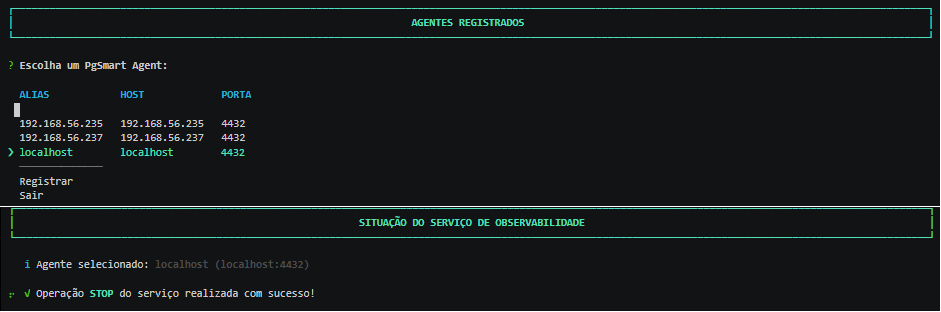 Figure 2 - Metric Exporter - watcher - Stop
Carregando...
Start Metric Panel Service
- Instructions
- Video
Terminal input
pgsmart obs watcher start
-
Select the
PgSmart Agentor register a new one.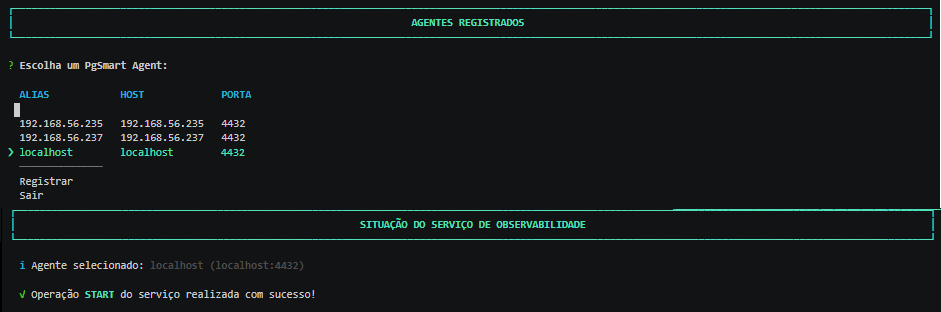 Figure 3 - Metric Exporter - watcher - Start
Carregando...
Restart Metric Panel Service
- Instructions
- Video
Terminal input
pgsmart obs watcher restart
-
Select the
PgSmart Agentor register a new one.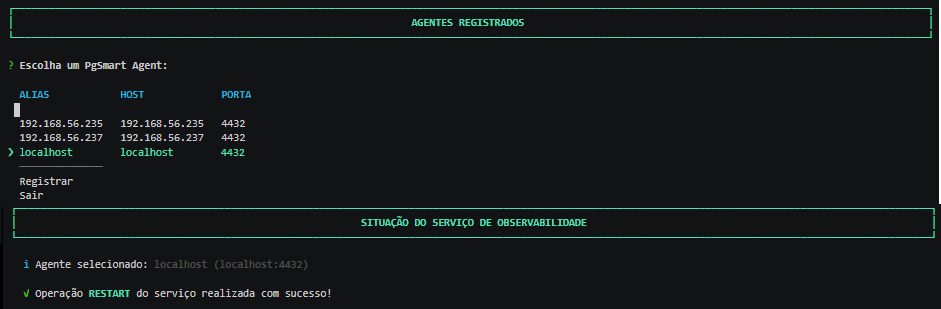 Figure 4 - Metric Exporter - watcher - Restart
Carregando...