PostgreSQL Metrics Exporter Configuration via PgSmart Web
The PostgreSQL Metrics Exporter collects information about transactions, query latency, memory usage by processes, database usage statistics, among others. This helps administrators monitor the health and performance of their PostgreSQL instances, enabling optimizations and adjustments.
Through this configuration option, it will be possible to specify the exposure port for PostgreSQL metrics to be collected by Prometheus.
To perform this operation, PgSmart automatically creates the "PgSmart" user in the monitored PostgreSQL instances. If preferred, this operation can be done manually. To do so, follow the steps below:
-
Connect to the desired PostgreSQL instance.
-
Execute the following command to create the PgSmart user:
Terminal inputCREATE USER pgsmart ENCRYPTED PASSWORD 'QWEpgTecSmartnisysRTY'; -
Execute the following command to grant the pg_monitor role (only privileges to read and execute monitoring views and functions) to the pgsmart user.
Terminal inputGRANT pg_monitor TO pgsmart;
The PostgreSQL Metrics Exporter will be configured, whether or not the PgSmart user exists. However, it will only start exporting metrics once the user exists with the required privileges in the monitored PostgreSQL instance.
-
Observability components installed.
- Instructions
- Video
-
Select the desired
Environmentfrom the dropdown in the top bar. -
Select the
Banco de Dadosoption from the side menu. The installed Database Services will be displayed incardsformat. -
From the list of cards, select the instance for which you want to configure the Metrics Exporter.
-
Select the
Métricastab. -
Adjust the value of the metrics exposure port and web interface.
-
Adjust the Access User (Optional). 6.1. Enter the Superuser for the PostgreSQL Instance. 6.2. Enter the Password for the PostgreSQL Instance Superuser.
-
Click
Salvar.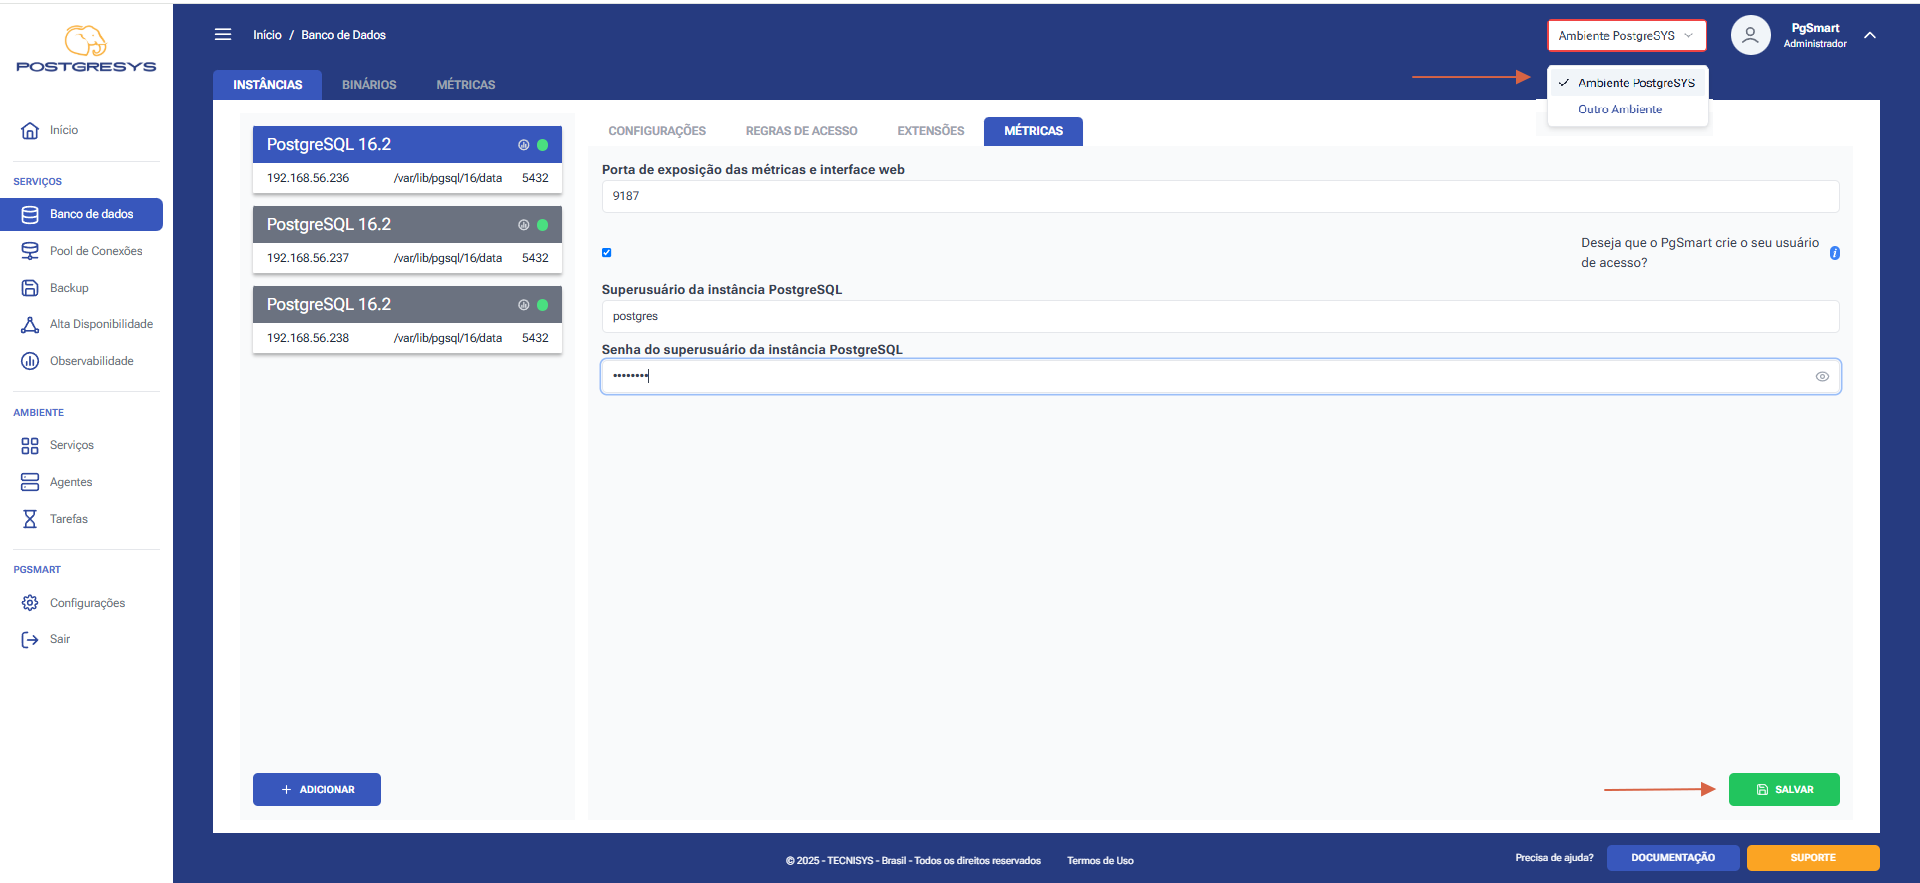 Figure 1 - PostgreSQL Exporter Configuration - Edit Port